
NinjaTrader Backtesting Explained: Which Method Should You Trust?
If you've spent any time in the NinjaTrader community, you've probably heard some version of this claim: "Strategy Analyzer results can't be trusted. The only honest backtest is Market Replay."
It sounds reasonable on the surface. Market Replay uses real tick data. Strategy Analyzer simulates fills. One feels more "real" than the other. But like most things in trading, the truth is more nuanced — and getting it wrong can lead you to dismiss valid strategies or, worse, trust invalid ones.
This article breaks down every backtesting method available in NinjaTrader 8, explains what's actually happening under the hood, and helps you understand when each method is appropriate. No vendor drama, no hot takes — just the technical reality so you can make informed decisions.
The Five Levels of Strategy Validation
Before diving into each method, it helps to understand where they sit in the hierarchy of reliability:
- Live trading — real money, real fills, real slippage. The only actual truth.
- Live sim (paper trading) — real market data, simulated fills. Very close to truth.
- Strategy Analyzer — historical bar data, simulated fills. Statistically powerful when used correctly.
- Market Replay — historical tick data replayed in real time. Precise on one path, but limited in scope.
- Chart overlay (Strategy Performance) — visual confirmation on a chart. Same engine as Strategy Analyzer, different presentation.
Notice that Strategy Analyzer ranks above Market Replay in this hierarchy. That's intentional, and I'll explain why as we go through each one.
Strategy Analyzer — The Workhorse
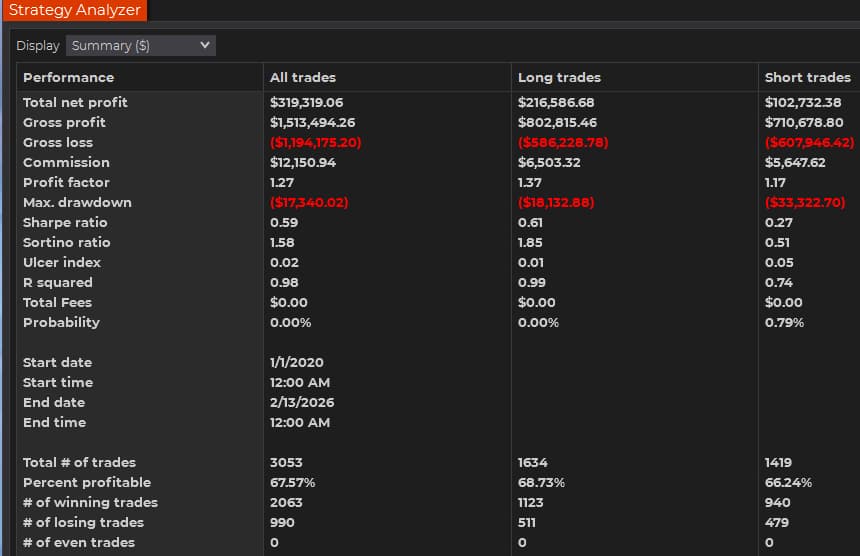
Strategy Analyzer is where most NinjaTrader users start backtesting, and for good reason. It processes years of historical data in seconds, generates detailed trade-by-trade reports, and supports optimization, walk-forward analysis, and parameter sweeps.
What It Actually Does
Strategy Analyzer reads historical bar data (the OHLC values for each completed bar) and feeds it to your strategy one bar at a time, exactly the way live data would arrive if you were sitting at your chart. Your strategy evaluates its conditions, places orders, and the Analyzer simulates fills based on the bar data available.
The Fill Simulation Question
This is where the controversy lives. When your strategy places an order, Strategy Analyzer has to figure out: did this order get filled, and at what price?
For market orders, this is straightforward. A market order placed on bar close fills at the next bar's open. Strategy Analyzer knows the next bar's open price. There's zero ambiguity.
For stop and limit orders, it gets slightly more complex. Strategy Analyzer knows the bar's High and Low, so it knows whether your price level was reached. What it doesn't know is the order in which price moved within the bar. Did price hit the high first, then the low? Or vice versa?
By default, NinjaTrader uses the OHLC assumption: price moved from Open → High → Low → Close. This matters in one specific scenario: when both your stop loss AND profit target could have been hit within the same bar. If the bar's range was wide enough to touch both levels, the Analyzer has to guess which one got hit first.
When This Matters (and When It Doesn't)
Here's the key insight that most of the "Strategy Analyzer is unreliable" crowd misses: this ambiguity only matters for strategies where intra-bar fill order changes the outcome.
Consider two different strategy architectures:
Strategy A uses Calculate = Calculate.OnBarClose on 5-minute bars with market entries. It evaluates conditions after each bar completes, enters at market on the next bar, and sets a stop loss 80 points away and a profit target 35 points away. The probability of both the stop and target being hit within the same 5-minute bar is extremely low. And over thousands of trades, the OHLC assumption washes out — sometimes it helps you, sometimes it hurts you, and the net effect approaches zero.
Strategy B uses Calculate = Calculate.OnEachTick on 1-minute bars with limit entries 2 points from the current price and a 4-point stop. Now the intra-bar fill sequence matters enormously. The Analyzer is simulating tick-by-tick price movement it doesn't actually have, and a 2-point limit with a 4-point stop on a 1-minute chart means both levels get hit within the same bar frequently. The OHLC assumption will produce phantom fills that never would have occurred in reality.
The bottom line: If your strategy uses OnBarClose calculation on 5-minute or larger bars with market entries and reasonably spaced stops/targets, Strategy Analyzer produces results that are functionally identical to what live trading would produce. The bar data is the bar data — a 5-minute bar that closed at 21,450 on January 15th looks the same whether you're watching it live or replaying it historically.
The Real Power of Strategy Analyzer
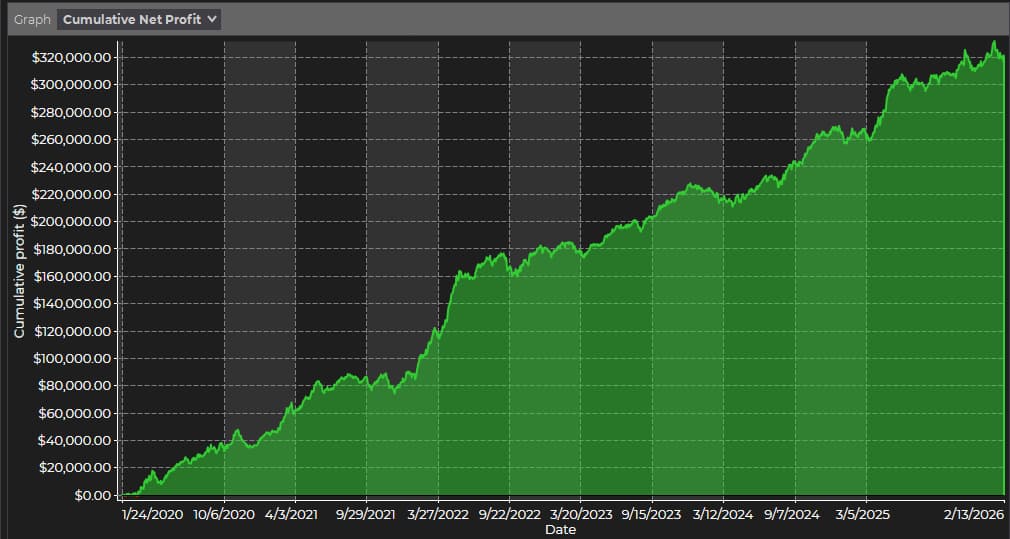
Speed. Strategy Analyzer can process 6 years of 5-minute data in under a minute. That speed enables things that no other method can:
- Walk-forward analysis — optimize on one period, test on the next, repeat. This is how you detect curve fitting.
- Parameter sensitivity testing — does the strategy break if you change a threshold by 1? If so, it's fragile and probably overfit.
- Monte Carlo simulation — randomize trade order across thousands of simulations to see the range of possible equity curves. What's the worst realistic drawdown? What's the probability of profit?
- Multi-year coverage — test across bull markets, bear markets, crashes, low volatility, high volatility. A strategy that only works in one regime is a ticking time bomb.
None of these are possible with Market Replay in any practical sense.
Chart-Based Strategy Performance
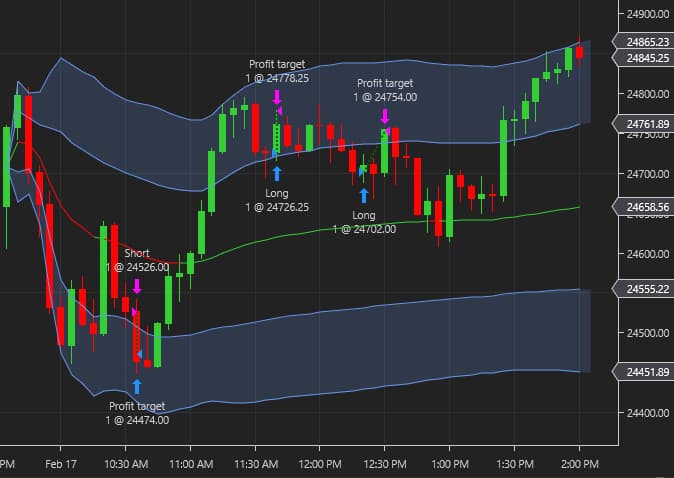
When you apply a strategy to a chart in NinjaTrader, you can see trade markers (entry/exit arrows), view the Strategy Performance window, and visually inspect how the strategy would have traded.
Under the hood, this is the same engine as Strategy Analyzer. The fill simulation logic is identical. The difference is presentation — you're seeing trades overlaid on your chart rather than in a summary report.
This is useful for:
- Visual sanity checking — do the entries and exits make sense when you look at the chart? Is the strategy entering where you'd expect based on the logic?
- Spotting edge cases — sometimes you'll see a trade that looks wrong and it leads you to discover a bug or an unhandled scenario in your code.
- Building intuition — scrolling through historical trades helps you understand your strategy's personality. Does it catch trends? Does it get chopped up in ranges?
But it's not a different or better form of backtesting. It's Strategy Analyzer with a visual wrapper.
Market Replay — Precision vs. Statistical Power
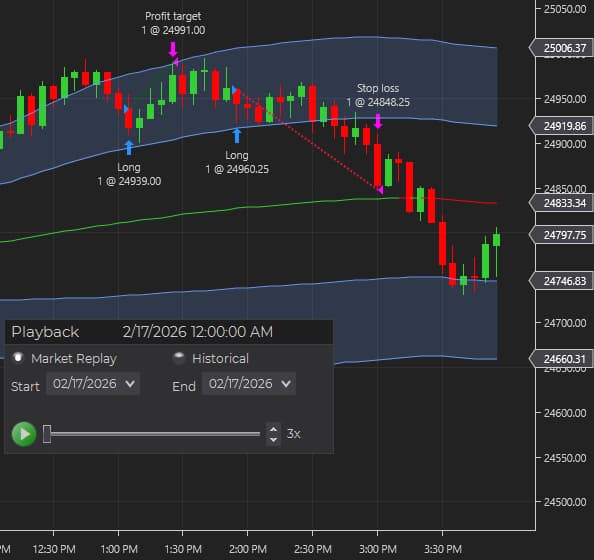
Market Replay downloads historical tick data from NinjaTrader's servers and replays it through your chart as if it were happening live. Your strategy processes each tick in sequence, places orders, and fills happen against the actual historical tick stream.
What It Does Well
Market Replay gives you the actual intra-bar price sequence. You know exactly whether price hit your stop before your target, because you can watch it happen tick by tick. For strategies that make decisions mid-bar based on tick-by-tick price action, this is genuinely more accurate than Strategy Analyzer's bar-level simulation.
The Problems Nobody Talks About
Problem 1: Speed Makes Statistical Analysis Impossible
Replaying one trading session takes... one trading session (at 1x speed). Even at 10x, a single year of data takes weeks. Want to test across 6 years of varied market conditions? You're looking at months of replay time. This makes walk-forward analysis, parameter sensitivity testing, and Monte Carlo simulation completely impractical. You get one pass through one sequence of events.
Problem 2: High-Speed Replay Destroys Tick Fidelity
This is the irony that kills the "Market Replay is always better" argument. Most people don't actually run replay at 1x speed — they crank it to 50x, 100x, or higher to make it practical. But at those speeds, NinjaTrader's replay engine can't process every tick. It drops ticks to keep up with the playback rate.
On a volatile instrument like NQ, a normal trading day might produce 500,000+ ticks. At 100x replay speed, the engine might process 10-20% of them. You're running a "tick-accurate" test on a decimated tick stream. The very precision that justifies using Market Replay is destroyed by the speed needed to make it practical.
Problem 3: Your Orders Weren't in the Original Order Book
This is the subtlest but most important point. The historical tick stream represents what happened without your orders in the market. If your strategy had been running live, your orders would have been in the order book, and the tick stream would have been different.
Place a 10-contract market order on MNQ? That's going to move the inside market by at least a tick or two, and every subsequent price is slightly different than what the replay shows. This is called market impact, and it exists in Strategy Analyzer too — but at least Strategy Analyzer doesn't pretend to be showing you "exactly what would have happened."
Market Replay gives you precision (exact tick sequence) but not accuracy (what would have actually happened with your orders in the market). People confuse the two constantly.
Problem 4: n=1
A single Market Replay run gives you one data point. One specific sequence of price events. You can't answer questions like:
- "If fills were slightly different, would the strategy still be profitable?"
- "What's the worst-case drawdown across thousands of possible trade sequences?"
- "Is this edge statistically significant, or could random entries produce similar results?"
These are the questions that actually matter for determining whether a strategy is tradeable, and Market Replay can't answer any of them.
When Market Replay Genuinely Adds Value
- You've already validated your strategy statistically through Strategy Analyzer (thousands of trades, Monte Carlo, walk-forward), and you want to visually confirm a handful of specific trades where you suspect the fill simulation might have been off.
- Your strategy is tick-sensitive (OnEachTick on small timeframes with tight stops) and you need to verify that the entries it's detecting actually occur in the real tick stream.
- You're debugging strategy behavior and want to watch it process live-speed data without risking real money.
Market Replay is a confirmation tool, not a validation tool. There's an important difference.
Live Sim (Paper Trading)
Live sim is the bridge between backtesting and live trading. Your strategy runs on your chart with real-time market data, but orders are simulated rather than sent to your broker.
Why This Step Matters
- Real-time data quality — live feeds behave slightly differently than historical data (delays, gaps, connection drops). Your strategy needs to handle this gracefully.
- Platform behavior — order routing, state management, and execution behave differently in real time than in backtesting. Things that work perfectly in the Analyzer can fail in production.
- Emotional calibration — watching your strategy trade in real time, even on paper, gives you a feel for the drawdowns and wait times that equity curves hide.
How Long Should You Paper Trade?
Long enough to see a meaningful sample of trades across different market conditions. For a strategy that trades 1-2 times per day, 4-8 weeks gives you 20-40 trades — enough to compare against backtest expectations. If the live sim results are within the confidence intervals from your Monte Carlo analysis, you're on track.
Live Trading — The Only Truth
Eventually, you have to put real money behind it. But if you've done the previous steps properly, going live shouldn't feel like a leap of faith. You should have:
- Statistical validation across thousands of historical trades
- Confidence intervals for expected performance
- Monte Carlo analysis showing the range of possible outcomes
- Live sim confirmation that real-time execution matches expectations
Start with minimum size (1 MNQ contract, for example), run it for a month, and compare results against your backtest expectations. Scale up gradually as confidence builds.
So Which Method Should You Use?
The answer depends on your strategy's architecture:
| Strategy Type | Best Primary Method | Why |
|---|---|---|
| OnBarClose, M5+ bars, market entries | Strategy Analyzer | Bar data is identical live vs. historical. Full statistical toolkit available. |
| OnBarClose, M1 bars, market entries | Strategy Analyzer | Still reliable, though M1 has more intra-bar noise. Consider spot-checking with replay. |
| OnEachTick, limit entries, tight stops | Market Replay (1x) + Strategy Analyzer | Replay for fill accuracy, Analyzer for statistical validation. Both are needed. |
| Scalping on tick/volume bars | Market Replay (1x) is essential | Bar construction itself depends on tick sequence. Strategy Analyzer can't reconstruct these bars accurately. |
The universal recommendation: Use Strategy Analyzer for statistical validation (it's the only tool that gives you the sample size for meaningful analysis), and use Market Replay as a spot-check for specific scenarios where you suspect fill simulation might matter.
The red flag to watch for: Anyone who claims one method is always superior without discussing strategy architecture is either oversimplifying or doesn't understand what's happening under the hood.
What's Next — How to Know If Results Mean Anything
Generating backtest results is step one. The harder question is: are those results meaningful, or are they the product of curve fitting and optimization bias?
A strategy can produce a beautiful equity curve in the Strategy Analyzer and still be completely untradeable. Conversely, a strategy with modest raw numbers might have a rock-solid statistical edge that holds up under every form of stress testing.
In Part 2 of this series, we'll cover the metrics and analysis methods that separate tradeable strategies from curve-fit illusions — including equity curve quality, Monte Carlo simulation, stability analysis, edge detection, and noise testing.
Read Part 2: How to Know If a Strategy Is Actually Worth Trading →
This article is for educational purposes only and does not constitute financial advice. Backtesting results, regardless of methodology, do not guarantee future performance. All trading involves risk of loss. Past performance is not indicative of future results.

Comments
No comments yet. Be the first to share your thoughts!
Leave a Comment