
Understanding Futures Correlation: What Every Trader Should Know
If you trade more than one futures instrument — or you're thinking about it — correlation is one of the most important concepts you need to understand. It affects everything from risk management to position sizing to whether you're actually diversified or just doubling down on the same bet.
I built a Futures Correlation Tool to analyze these relationships across any timeframe using years of historical data, with options for both Regular Trading Hours (RTH) and Electronic Trading Hours (ETH). What the data reveals might surprise you — even if you've been trading for years.
Let's dig in.
What Is Correlation and Why Should You Care?
Correlation measures how closely two instruments move together on a scale from -1.0 to +1.0. A correlation of +1.0 means two instruments move in perfect lockstep. A correlation of -1.0 means they move in exactly opposite directions. A correlation near 0 means there's no meaningful relationship at all.
An important clarification: all correlations in this article are calculated using bar-to-bar percentage returns, not raw price levels. This is a critical distinction — two instruments can both trend upward over time (prices rising together) while having near-zero correlation in their actual bar-to-bar moves. Returns-based correlation tells you how similarly two instruments behave, which is what matters for trading decisions.
One more thing worth stating upfront: correlation doesn't mean one instrument causes the other to move. It simply measures how often they move together. ES doesn't make NQ go up — they both respond to overlapping market forces.
Here's why this matters practically:
If you're trading two highly correlated instruments, you might think you're diversified — but you're not. You're essentially doubling your exposure to the same move. If ES drops hard and you're also long NQ, you've got two losing positions, not a hedge.
If you're trying to hedge, you need to know whether your hedge actually works — and whether it works consistently or only in certain market conditions.
If you're pairs trading or spread trading, correlation is the foundation of your entire strategy. And that correlation better be stable, or your edge disappears.
The Equity Index Illusion: "Everything Moves Together"
Let's start with the four major U.S. equity index futures: ES (S&P 500), NQ (Nasdaq 100), YM (Dow 30), and RTY (Russell 2000).
Most traders assume these all move together. And they're partially right — but the degree of correlation varies a lot more than you'd expect.
Using 5-minute bars over six years of Regular Trading Hours (RTH) data, here's what the overall correlations look like:
| Pair | Correlation |
|---|---|
| YM / ES | 0.9385 |
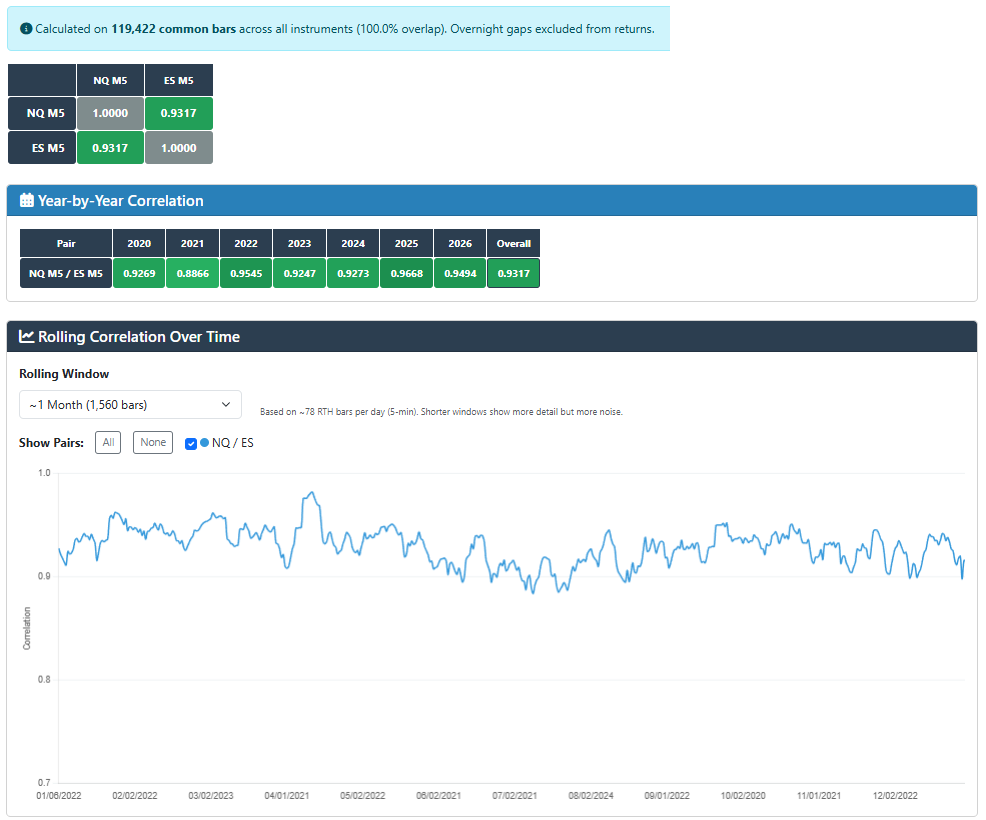
| NQ / ES | 0.9320 |
| RTY / ES | 0.8225 |
| YM / RTY | 0.7993 |
| YM / NQ | 0.7992 |
| RTY / NQ | 0.7482 |
A few things jump out immediately.
YM/ES is actually the tightest pair — not NQ/ES as many traders assume. This makes sense when you think about it. The Dow 30 is heavily weighted toward mega-cap blue chips that overlap significantly with the S&P 500's top holdings. NQ, with its tech concentration, drifts further from ES than the Dow does.
RTY is the black sheep. The Russell 2000 has noticeably weaker correlations with everything else. RTY/NQ at 0.7482 is the weakest pair in the group. Small caps and tech-heavy large caps really do march to different drums — especially on intraday timeframes.
These relationships aren't static. The year-by-year data shows significant variation. In 2024, RTY/NQ dropped to just 0.6160 as the "Magnificent 7" mega-cap tech stocks drove the NQ while small caps lagged behind. That's a massive divergence for two instruments most traders lump into the same "equities" bucket.
The bottom line: if you're trading both ES and NQ, you're about 93% correlated. You're not diversified — you're leveraged to the same trade. But if you add RTY into the mix, you're getting meaningfully different exposure, at least some of the time.
One important distinction: correlation measures direction, not magnitude. NQ may move in the same direction as ES, but often with significantly larger swings — roughly 1.5 to 2x the volatility. Two instruments can be highly correlated and still carry very different levels of risk per contract.
Timeframe Matters: The Same Pair Looks Different at Different Scales
One of the most interesting findings from the data is how correlation changes across timeframes. Here's the NQ/ES pair measured across a range of bar sizes, from 1-minute all the way up to 4-hour, all using six years of RTH data:
| Timeframe | Correlation | Common Bars |
|---|---|---|
| 1-minute | 0.9205 | 597,036 |
| 5-minute | 0.9317 | 119,422 |
| 10-minute | 0.9354 | 59,717 |
| 30-minute | 0.9381 | 16,232 |
| 60-minute | 0.9477 | 10,581 |
The pattern is clear: higher timeframes produce higher correlations.
This makes intuitive sense. On a 1-minute chart, micro-level order flow differences — a large NQ order hitting the book, a brief ES dislocation, different algorithmic execution timing — create noise that temporarily decouples the two instruments. By the time you zoom out to 60-minute bars, those micro-divergences have washed out and the macro moves dominate.
For traders, this has practical implications:
- Scalpers working 1-minute charts will see more divergence between correlated pairs, which can create short-lived spread opportunities — but also more false signals.
- Swing traders on 30 or 60-minute charts can rely more heavily on the correlation holding. When NQ/ES diverges at this timeframe, it's more likely to be a meaningful signal rather than noise.
- The rolling correlation charts tell the story visually. Using a ~1 month rolling window (approximately 1,560 bars on 5-minute data), the 1-minute chart shows much more volatility in the correlation itself, with occasional dips below 0.80. The 60-minute chart is remarkably smooth, rarely dipping below 0.90.
Step Outside Equities and Correlations Evaporate
Here's where it gets really interesting. Let's add crude oil (CL), the euro (6E), and gold (GC) alongside ES:
| Pair | Correlation |
|---|---|
| 6E / GC | 0.3530 |
| 6E / ES | 0.2556 |
| GC / ES | 0.1673 |
| CL / GC | 0.0017 |
| CL / ES | 0.0009 |
| CL / 6E | -0.0002 |
This is a completely different world from the equity indices.
Crude oil is essentially uncorrelated with everything. CL/ES at 0.0009 is statistical noise — there is no meaningful relationship between 5-minute crude oil moves and 5-minute S&P moves. CL/6E at -0.0002 is as close to zero as you'll ever see in real market data.
The euro/gold pair at 0.3530 is the strongest cross-asset relationship — and even that would be considered weak by equity index standards. The connection makes intuitive sense (both tend to move inversely to dollar strength), but at 0.35 on 5-minute bars, it's not a reliable tradeable relationship.
Cross-asset relationships are unstable and regime-dependent. CL/ES swings from -0.0204 in 2020 to 0.3154 in 2025. There's no stable statistical edge to rely on.
The practical takeaway: If you're only trading ES and NQ, you're basically trading the same instrument. Adding CL or GC to your portfolio actually gives you genuinely independent exposure. That's real diversification, not the illusion of it.
Currencies: The Middle Ground
Currency futures live in an interesting middle zone — more correlated than cross-asset pairs but much less correlated than equity indices.
Looking at the British pound (6B), euro (6E), and Swiss franc (6S) on 1-minute bars during Electronic Trading Hours (ETH):
| Pair | Correlation |
|---|---|
| 6E / 6S | 0.6993 |
| 6B / 6E | 0.6868 |
| 6B / 6S | 0.5286 |
6E/6S is the strongest pair at ~0.70, which makes sense — both are European currencies heavily influenced by ECB policy and eurozone economics. But 0.70 is a far cry from the 0.93 we see in NQ/ES.
The British pound is the odd one out. 6B/6S at 0.5286 is surprisingly low for two currencies that are both "not the dollar." The structural decoupling of sterling from its European neighbors is clearly visible in the data. Since 2020, this pair has bounced around between 0.45 and 0.68 with no clear trend toward convergence.
Year-to-year variation is significant. 6E/6S jumped to 0.8250 in 2025 — likely reflecting converging ECB and SNB policies — but sat at just 0.6110 in 2024. Traders relying on a stable currency correlation need to monitor these shifts.
The rolling correlation charts for currencies show much more volatility than equity indices. Where NQ/ES barely wiggles, 6B/6S regularly dips below 0.30. Currency correlations are moderate but unreliable compared to their equity index counterparts.
Bonds vs. Equities: The Regime-Dependent Relationship
Perhaps the most fascinating correlation in futures markets is between equities and bonds. Using Electronic Trading Hours (ETH) data, ES/ZN (S&P 500 vs. 10-Year Treasury Note) shows an overall correlation of just -0.0560 — but that number is deeply misleading.
| Year | ES/ZN Correlation |
|---|---|
| 2020 | -0.3280 |
| 2021 | -0.0840 |
| 2022 | 0.1333 |
| 2023 | 0.1569 |
| 2024 | 0.0599 |
| 2025 | -0.2286 |
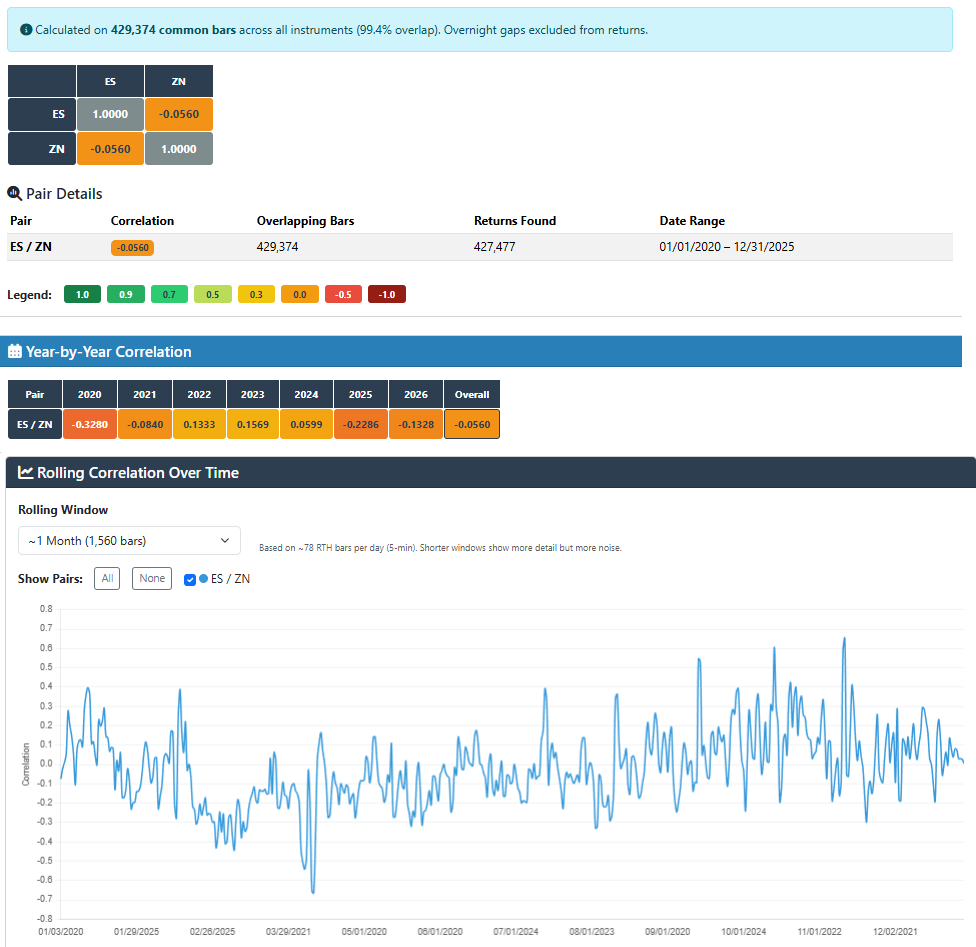
The story here is entirely about regime shifts. In 2020, when COVID crashed equities, money poured into bonds — classic flight-to-safety behavior producing a strong negative correlation. Then in 2022-2023, during aggressive rate hikes, both stocks AND bonds were selling off together. The traditional hedge completely broke down, and the correlation flipped positive.
The rolling correlation chart is the most dramatic of any pair we've looked at. It swings from roughly -0.7 to +0.6 — a range of 1.3. Compare that to NQ/ES, which has a total range of about 0.15. The ES/ZN relationship fundamentally changes character depending on the macroeconomic environment.
For traders using ZN as a hedge against equity positions, this is critical information. That hedge only works during "normal" risk-on/risk-off environments. During inflation-driven selloffs — like 2022 — your bond "hedge" actually adds to your losses. You need to understand the macro regime you're in before relying on this relationship.
Putting It All Together: The Correlation Spectrum
Here's a summary of the full spectrum we've covered:
| Category | Example Pair | Correlation | Stability | Session |
|---|---|---|---|---|
| Same asset class (equities) | NQ / ES | ~0.93 | Very stable | RTH |
| Same asset class (equities) | RTY / NQ | ~0.75 | Moderately stable | RTH |
| Same asset class (currencies) | 6E / 6S | ~0.70 | Variable | ETH |
| Cross-asset | 6E / ES | ~0.26 | Variable | RTH |
| Cross-asset | CL / ES | ~0.00 | No relationship | RTH |
| Cross-asset (bonds/equities) | ES / ZN | ~-0.06 | Regime-dependent | ETH |
Practical Implications for Traders
1. Know Your True Exposure
If you're long both ES and NQ, you're roughly 93% exposed to the same move. Size accordingly. Treat them as partially overlapping positions, not independent trades.
Here's a simple way to think about it: say you're long 2 ES contracts and 2 NQ contracts. You might feel like you have 4 independent positions working for you. But with a 0.93 correlation, those NQ contracts are almost entirely redundant exposure. If ES drops hard, NQ is dropping with it. You haven't diversified — you've leveraged. That distinction matters a lot when you're managing daily loss limits on a prop firm account.
2. Real Diversification Requires Different Asset Classes
Adding a second equity index doesn't diversify much. Adding crude oil, gold, or currencies gives you genuinely independent exposure.
3. Correlations Change Over Time
A relationship that worked last year may not work this year. The 2021 and 2024 data show that even "reliable" correlations can break down during specific market regimes. Monitor these shifts — don't set and forget.
4. Timeframe Affects the Relationship
The same pair shows different correlation characteristics at different bar sizes. If you're making decisions based on daily correlation data but trading 1-minute charts, you may be working with the wrong information.
5. Hedging Isn't Always Hedging
The ES/ZN relationship shows that traditional hedges can break down — or even work against you — during certain macro environments. Understand the regime you're in before relying on historical correlations.
Explore the Data Yourself
Before adding another instrument to your account, check whether you're increasing diversification — or just doubling your risk.
I built a Futures Correlation Tool that lets you compare any combination of futures instruments across any timeframe. It calculates overall correlation, year-by-year breakdowns, and rolling correlation over time — all with overnight gaps excluded. Whether you're evaluating a pairs trade, sizing positions across correlated instruments, or stress-testing your portfolio diversification, the data is there. Go explore it.
Correlations in this article are calculated across various timeframes from 1-minute to 4-hour bars, covering January 2020 through December 2025. Equity index and cross-asset comparisons use Regular Trading Hours (RTH) data. Currency and bond/equity comparisons use Electronic Trading Hours (ETH) data. Overnight gaps are excluded from returns. Past correlation patterns do not guarantee future behavior.

Comments
No comments yet. Be the first to share your thoughts!
Leave a Comment