
Tachyon
A 0DTE SPX iron-condor signal, delivered to Slack at 3:51 PM ET. You get a heads-up at 3:45 and the confirmed trade at 3:51 — copy the strikes from the included spreadsheet, place the order, and let it settle to cash at 4:00. Nine-minute hold, zero intraday management.
What do these numbers mean? — Sharpe, Sortino, K-Ratio & SQN explained
A measure of return per unit of risk. Above 1.0 is good, above 2.0 is considered excellent. At 2.32, Tachyon delivers strong risk-adjusted returns — well into the range professional managers aim for.
Higher than the Sharpe — meaning most of the strategy's volatility is upside volatility. At 2.58, downside swings are small and controlled; the variance comes more from winners than from losers.
Measures equity curve consistency. Above 2.0 is excellent. At 7.21, the equity curve grows at a near-perfectly linear rate with minimal deviation — exceptionally rare.
System Quality Number measures the strength of the edge relative to its variability. Above 5.0 is considered excellent — at 6.10, Tachyon's edge is both large and highly consistent across its 513-trade history.
What You Actually Do Each Afternoon
When the 15:51 signal fires, you open the Tachyon Condor Selector spreadsheet, read the highlighted row for your tier, click Copy Order, paste it into your broker, and submit. The spreadsheet shows live strikes, deltas, and credits for every tier and width — no math, no guessing.
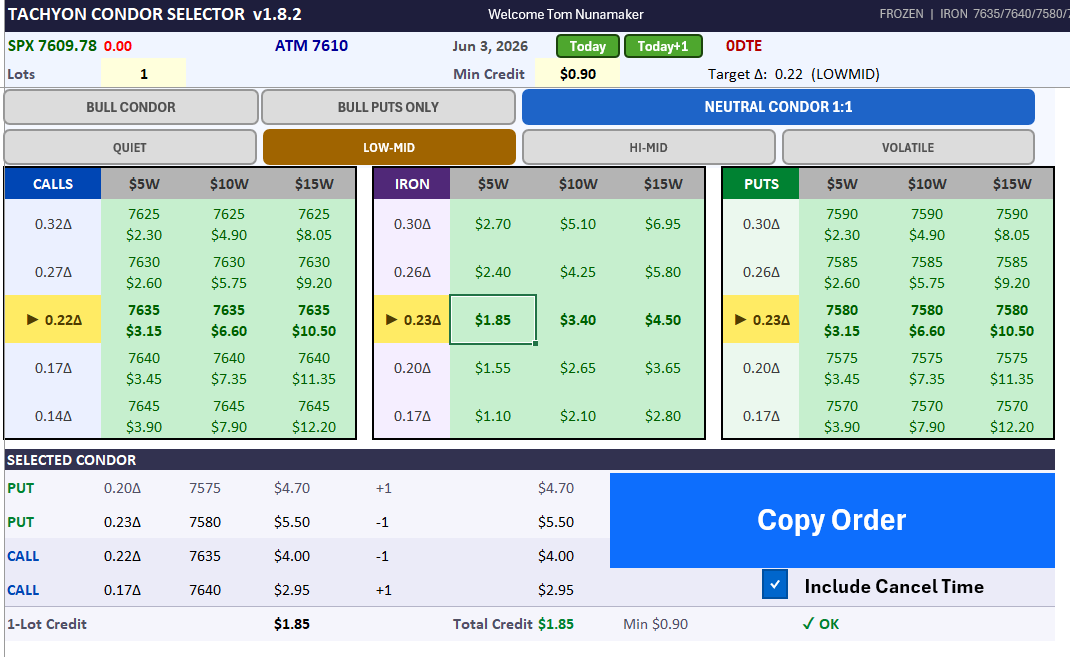
Included with your subscription. It reads the live SPX chain, highlights the strikes that match the signal and your tier, enforces the minimum credit, and builds the exact order string — including the 15:53 ET auto-cancel. Your job is to verify the credit and click submit.
The Tachyon Alert Workflow
The NinjaTrader strategy reads market conditions in real time and sends two alerts — a heads-up at 15:45 and a confirmed signal at 15:51. Subscribers have time to prepare before the trade window opens.
The strategy reads early indicators and sends a preliminary status. Not a guaranteed signal — but accurate enough to let subscribers get ready.
NEUTRAL SIGNAL LIKELY
Symmetric condor likely — 1 put + 1 call spread
Stand by for 15:51 confirmation
or
SKIP LIKELY — conditions unfavorable
No trade expected today
All conditions evaluated. If confirmed, the alert includes everything needed to place the trade. Subscriber verifies credit and enters.
Structure: Symmetric Iron Condor — Neutral
Put side: ≈ 0.25Δ × 1 spread
Call side: ≈ 0.25Δ × 1 spread
Spread width: $5
Min credit: $0.90 — verify before entering
or
NO TRADE — conditions not met
Open the Tachyon Condor Selector. It maps the 15:51 alert to your tier's strikes and deltas and confirms the $0.90 minimum credit is met. If it isn't — no trade.
Click Copy Order to grab the ready-built order string, paste it into your broker, and send as a limit at natural price. No manual strike hunting — 0DTE liquidity fills fast.
No stops. No adjustments. SPX cash-settles at 16:00 automatically. P&L posts to your account. Check results after the close.
Plenty of 0DTE approaches are hands-on — you watch the position, adjust when it moves against you, and decide when to close. Tachyon is the opposite design: once you enter, there's nothing to manage. One scheduled decision, then you're flat at the close. Both styles can work — this one is built for traders who'd rather not spend the afternoon in front of charts.
Whether you work market hours or trade from another time zone, the fixed 3:51 PM ET entry means you prepare, place one order, and you're done in under ten minutes.
The market conditions that drive the go/no-go decision — momentum state and directional signal — are relatively stable in the final 15 minutes of the session. A strong directional signal at 15:45 rarely reverses by 15:51. A day with extreme momentum at 15:45 almost always remains a skip at 15:51.
The pre-alert won't be right 100% of the time — occasionally a signal strengthens or weakens in those 6 minutes. That's why the 15:51 confirmed alert is the one to act on. But the pre-alert lets subscribers prepare their broker, locate the strikes, and price the spread before the confirmation arrives — turning a 60-second scramble into a relaxed 5-second click.
Who Tachyon Is — and Isn't — For
A Live Trade, Start to Finish — Friday, May 29
Tachyon went live in late May 2026, so the live record is still measured in days, not years. Here is one real trade from my own account, start to finish — the 15:51 signal fired a neutral condor, I entered from the spreadsheet, and it settled at the close. Watch the spread decay as the nine minutes run out.
One trade is not a track record. This shows the signal and workflow working in a live market — not a promise of typical or future results. Expect losing days too; the backtest below shows the full range.
Click any image to open it full size
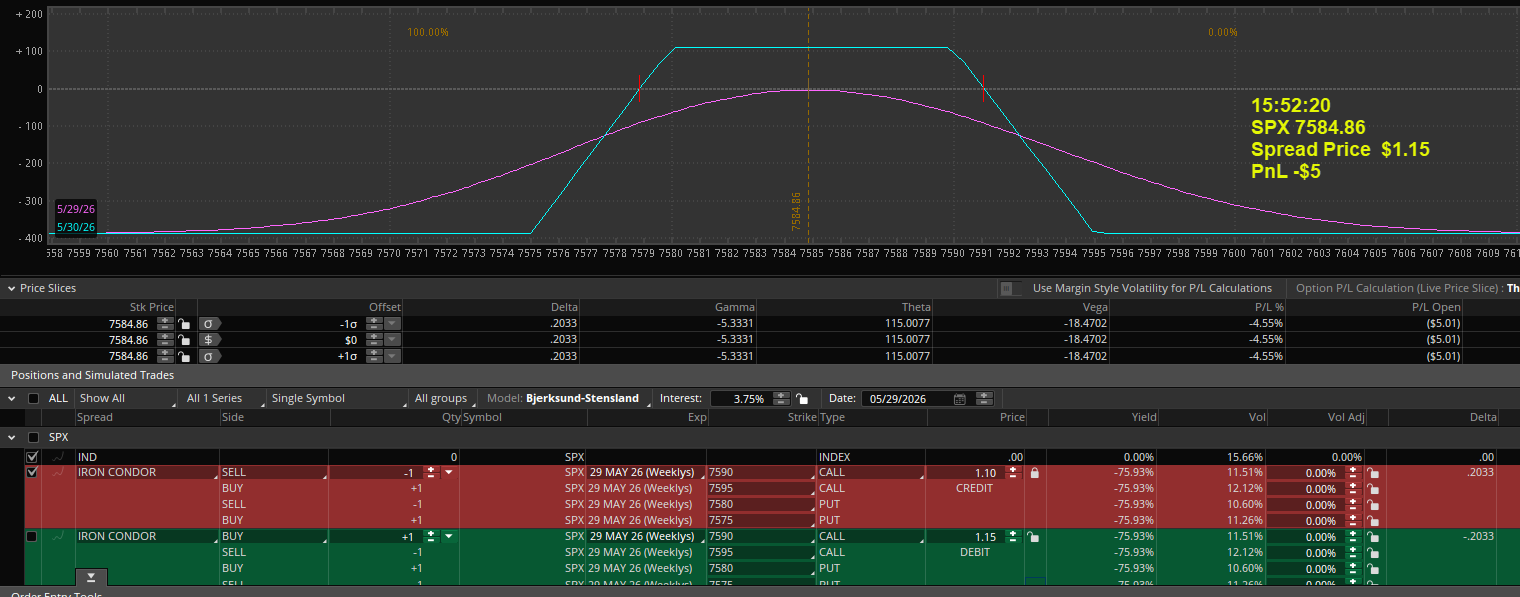
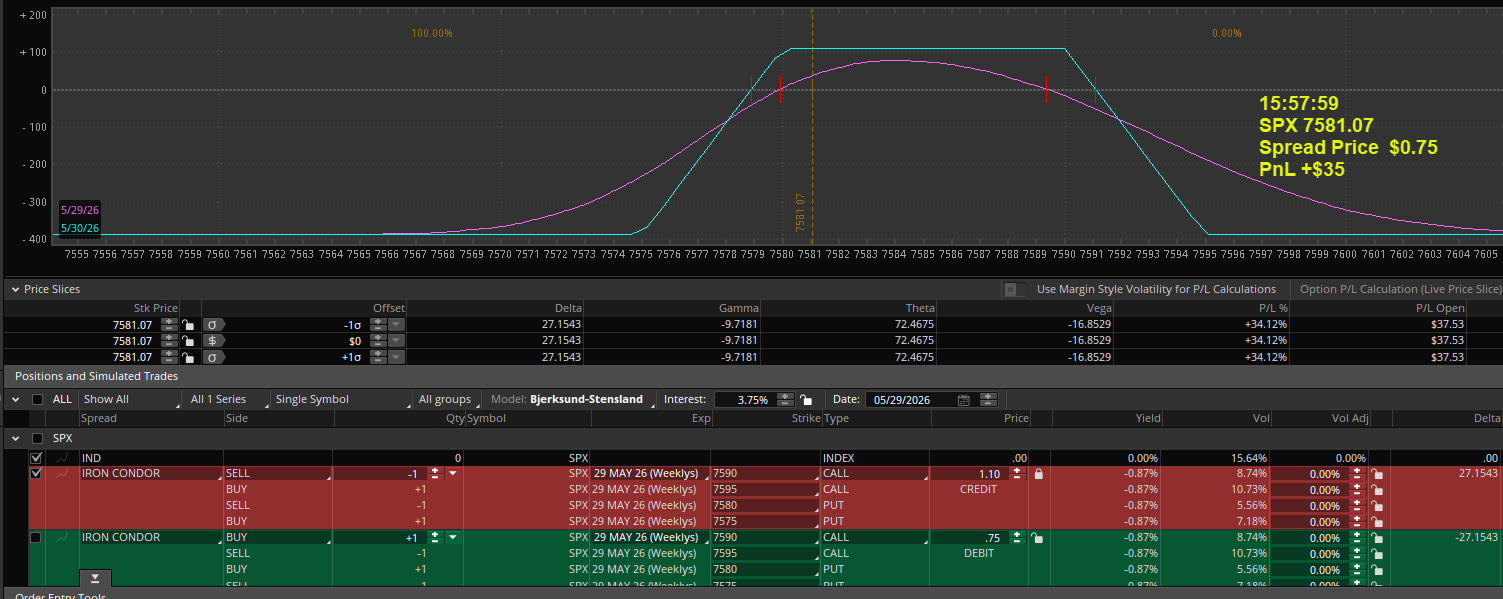
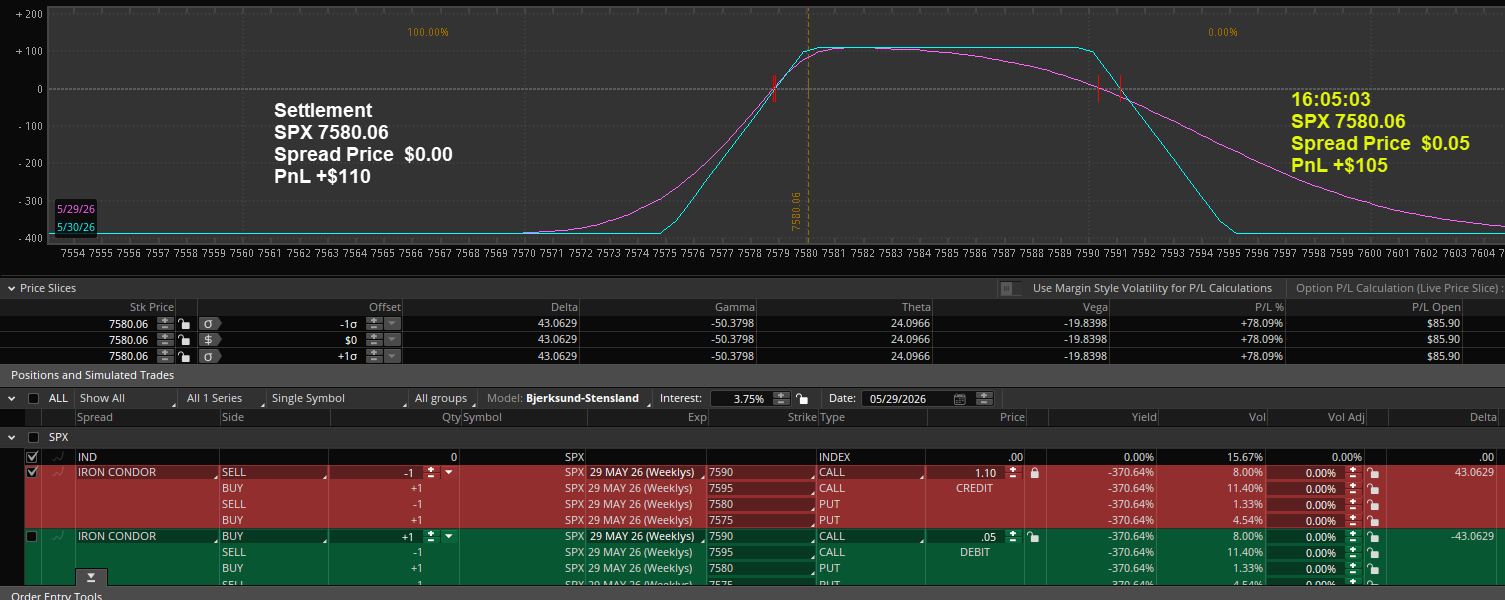
How settlement works: SPX cash-settles to its official settlement value (SET), which the exchange publishes a few minutes after the close once all closing prints are consolidated — and it can differ from the 16:00 screen price by a meaningful amount (I've seen it move more than $0.20). On 5/29, SET printed 7580.06, leaving both short strikes (7580 put, 7590 call) out of the money, so the condor expired worthless and kept the full 1.10 credit (+$110). The ~$0.05 on the 16:05 screen is just the live mark while SET was still being calculated. All Tachyon P&L uses the published SET, sourced from FRED — not the 16:00 mark — because that difference is exactly where sloppy backtests go wrong.
A Subscriber's First Week
And here is the first complete week from subscriber Tom Henley — four trading days, eight contracts, posted to the members' Slack as the trades happened. Real fills in a real account.
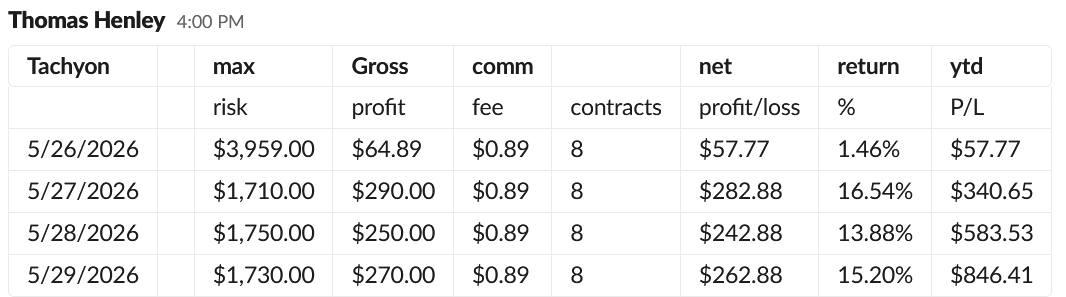
Net of commissions, May 26–29, 2026, 8 contracts per day. Individual results vary with account size, fills, and the strikes each trader selects within the target range.
Track Record
K-Ratio = 7.21
| Year | Trades | Win Rate | Profit Factor | Net P&L | Avg / Trade |
|---|---|---|---|---|---|
| 2022 (partial) | 74 | 82.4% | 1.68 | +$2,915 | +$39.39 |
| 2023 | 94 | 78.7% | 1.85 | +$3,802 | +$40.44 |
| 2024 | 130 | 82.3% | 2.81 | +$8,127 | +$62.52 |
| 2025 | 133 | 77.4% | 1.79 | +$5,324 | +$40.03 |
| 2026 (partial) | 82 | 73.2% | 1.36 | +$1,641 | +$20.01 |
| Total | 513 | 78.9% | 1.89 | +$21,808 | +$42.51 |
All figures are net of commissions — $0.55/contract to open (entry only; SPX cash-settles so no closing trade). Average credit collected: $1.26. Every year profitable. 2022 reflects the earliest period of SPX daily expirations. 2025 reflects elevated geopolitical volatility. Strategy: BULL PUTS ONLY (4 put spreads) + NEUTRAL CONDOR 1:1 · $5 wide · No Monday · mc≥$0.90 · |mom|<7 · ZLO>1.80.
Trade Frequency
The strategy is selective — it only trades when conditions are favorable. Mondays are always skipped. On the remaining four days, the system trades roughly 55% of eligible days based on market conditions.
Selectivity is a feature, not a limitation. The system's ability to sit out unfavorable days is a primary driver of the 78.9% win rate. On the days it skips, expected profitability is lower — those skipped days are not missed opportunities, they're avoided risk.
Four years of research show that Monday performs structurally differently from the rest of the week. It is not a calendar quirk — it reflects how institutional positioning resets after the weekend, with weekend gap risk and Monday news flow producing wider bid-ask spreads and more unpredictable final-hour moves.
By skipping Monday, the strategy concentrates capital on the four days that carry the edge and avoids a disproportionate share of the drawdown. This is a data-confirmed decision, not an arbitrary filter — across the full four-year backtest, Mondays netted under $200 total. The signal still fires on Mondays, but the edge isn't there, so Tachyon skips them and holds that rule constant across every robustness test.
How Long Should You Give It?
The biggest mistake a new subscriber can make is quitting after one bad week. A few losing trades in a row says almost nothing about the edge — it's the ordinary variance a high-probability strategy produces all the time. The right way to judge Tachyon is over a rolling window, and the data on that is about as clear as it gets.
Across all 41 overlapping one-year periods from May 2022 to July 2026, none finished in the red — and every window of six months or longer was profitable too. The shorter the hold, the more variance you take on; a full-year horizon is where the edge shows up most consistently. That's the case for judging Tachyon over a window of months, not a single rough week. Backtested over a four-year sample — not a forward guarantee.
were profitable
| Hold Period | % Profitable | Worst Window | Avg Window |
|---|---|---|---|
| 1-Month | 78.8% | −$859 | +$419 |
| 3-Month | 96.0% | −$1,446 | +$1,318 |
| 6-Month | 100.0% | +$713 | +$2,770 |
| 12-Month | 100.0% | +$2,770 | +$5,773 |
| 18-Month | 100.0% | +$5,552 | +$9,071 |
| 24-Month | 100.0% | +$8,680 | +$12,456 |
Windows are overlapping periods stepped through the May 2022–July 2026 backtest. The shorter the hold, the more variable the outcome — which is exactly why a full-year horizon, not a one-month trial, is the right way to judge the edge. Every 6-month-and-longer window was profitable in this sample.
A strategy that wins roughly four out of five trades will still string together losing days — that's ordinary variance, not a broken edge. The mistake is reading a rough week as a verdict and cancelling before the edge has room to work. In the four-year backtest, no single week was guaranteed green, but every rolling twelve-month window finished profitable, and the worst one still cleared +$2,770 per lot.
If you trade Tachyon, give it at least a full window before you judge it. Walking away after one rough stretch is the single decision this data argues against most clearly. Backtested results — not a promise of future returns.
Why Multiple Subscribers Isn't a Problem
A common concern with any signal service is market impact — that many traders acting on the same signal will move prices or erode the edge. This strategy is specifically designed to avoid that problem.
World's Most Liquid Options
SPX 0DTE options trade over 1 million contracts per day. End-of-day volume is especially high as institutional hedgers close positions. A few dozen subscribers represent a tiny fraction of available liquidity.
Delta Range Flexibility
Subscribers are given a target delta range, not an exact strike. Each subscriber independently selects their preferred delta within the range — naturally distributing orders across multiple strikes and prices.
Instant Fills at Natural Price
SPX 0DTE options have tight bid-ask spreads and deep markets at end of day. Limit orders at natural price fill immediately. No single subscriber's order moves the market.
Different Spread Widths
Subscribers can choose $5, $10, or $15 wide spreads at the same delta target — further distributing orders across different strikes and structures without affecting one another.
Institutional Participation
At 15:51 ET, the options market is dominated by institutional hedgers and market makers managing large end-of-day exposures. Retail order flow is a drop in the ocean.
Independent Execution
Every subscriber executes through their own broker at their own time. Orders are completely independent — different brokers, different accounts, different timing within the window.
On a single ordinary session, near-money SPX 0DTE strikes run roughly 90,000 to 200,000 contracts each — calls on the upside, puts on the downside, exactly where Tachyon's legs sit. All Tachyon subscribers combined represent less than 0.3% of volume at any single strike — completely invisible to the market.
The Research Behind the Signal
Tachyon isn't a hunch or a few lucky months. I engineered it by processing the full structural history of the modern SPX 0DTE market at one-minute resolution — on a research rig I built and run myself.
Every one-minute snapshot of the SPX 0DTE option chain since daily expirations began — implied volatility and first-order Greeks included, sourced from ThetaData.
I stress-tested 344,068 parameter configurations — deltas, widths, credit floors, filters — across the four-year history to isolate the most robust risk-reward tiers, not the prettiest backtest.
No slow cloud servers or third-party backtest platforms — a dedicated local quant rig: a 16-core Ryzen 9 5950X with 128GB of RAM, running Python and DuckDB. Processing locally at that speed let me test the strategy against hundreds of thousands of parameter sets and confirm the edge is structurally sound and repeatable — not curve-fit to one stretch of market. I built a machine to crunch 168.8 million simulations so your daily execution stays a five-second click.
Statistical Validation
The strategy was subjected to rigorous independent robustness testing across multiple methodologies. Score: 100/100 · TRADABLE Stability: 87
| Expectancy per trade | $28.64 → $55.74 |
| Profit Factor | 1.50 → 2.45 |
| Win Rate | 75.4% → 82.3% |
| Max Drawdown range | $932 → $2,663 |
All confidence intervals bootstrapped from the 513-trade dataset. Entire expectancy and profit factor ranges are positive.
| Metric | First Half (256) | Second Half (257) | Change |
|---|---|---|---|
| Win Rate | 80.1% | 77.8% | −2.3% |
| Profit Factor | 1.98 | 1.80 | −9.1% |
| Expectancy | $46.48 | $38.56 | −17.0% |
| Max Drawdown | $1,281 | $1,656 | +29.3% |
| Total P&L | $11,899 | $9,910 | — |
A curve-fit strategy shows a strong first half that falls apart out of sample. Tachyon stays profitable across both halves of the four-year record — the second half carries the more recent, higher-volatility regime and still clears a 1.80 profit factor with a smaller drawdown than the first. The edge doesn't live in one stretch of the data.
| Median drawdown | $1,482 |
| 95th percentile drawdown | $2,406 |
| Worst case drawdown | $5,488 |
Each simulation randomly resamples the 513-trade dataset with replacement and 10% P&L variance. All 20,000 simulations were profitable. The 95th-percentile drawdown ($2,406) is the figure used to size account capital.
| Expectancy per trade | $42.51 |
| 95% CI expectancy range | $28.64 → $55.74 |
| 95% CI profit factor | 1.50 → 2.45 |
| 95% CI win rate | 75.4% → 82.3% |
| Sample confidence level | 100% (90/95/99% all met) |
All performance figures shown are backtested results derived from historical SPX 0DTE options data (May 2022 – July 2026). Backtesting simulates how a strategy would have performed based on past market conditions — it does not predict or guarantee future results. Real trading involves factors not captured in backtests including slippage, liquidity constraints, execution delays, and changing market regimes. Tachyon is not an annuity, guaranteed income product, or investment advisory service. Monthly income figures represent historical averages — actual monthly results will vary and some months may show losses. Past performance does not necessarily indicate future results. Trade only with capital you can afford to lose.
Account Sizing — $5 Wide (Standard)
Historical max drawdown over 4 years: $1,656 per lot. Monthly income: $423/lot average. Capital is sized to the Monte Carlo 95th-percentile drawdown ($2,406/lot) — a stress-tested cushion, not just the historical worst. All figures net of commissions.
| Lots | Annual Net | Monthly | 10% Min Capital | 15% Min Capital | 20% Min Capital | 25% Min Capital | 30% Min Capital |
|---|---|---|---|---|---|---|---|
| 1 lot | +$5,080 | $423 | $24,100 | $16,100 | $12,100 | $9,700 | $8,100 |
| 2 lots | +$10,160 | $847 | $48,200 | $32,200 | $24,200 | $19,400 | $16,200 |
| 3 lots | +$15,240 | $1,270 | $72,300 | $48,300 | $36,300 | $29,100 | $24,300 |
| 4 lots | +$20,320 | $1,693 | $96,400 | $64,400 | $48,400 | $38,800 | $32,400 |
| 5 lots | +$25,400 | $2,117 | $120,500 | $80,500 | $60,500 | $48,500 | $40,500 |
| 6 lots | +$30,480 | $2,540 | $144,600 | $96,600 | $72,600 | $58,200 | $48,600 |
| 8 lots | +$40,640 | $3,387 | $192,800 | $128,800 | $96,800 | $77,600 | $64,800 |
| 10 lots | +$50,800 | $4,233 | $241,000 | $161,000 | $121,000 | $97,000 | $81,000 |
| Return on min capital | 21.1% | 31.6% | 42.0% | 52.4% | 62.7% | ||
Standard is the recommended starting tier — 4 put spreads, $5 wide. Subscribers can also size up the spread width or spread count (the Growth and High Income tiers) once comfortable with the workflow; the alert is identical. Minimum capital is the Monte Carlo 95th-percentile drawdown ($2,406/lot) divided by your chosen drawdown tolerance — a deliberately conservative basis that funds a drawdown worse than anything in the 4-year history. Return-on-capital figures are the average annual net against that stress-tested minimum, single lot held flat.
Account Sizing — $10 Wide (High Income)
The income-focused tier: 6 put spreads, $10 wide. Net 4yr: +$35,711/lot · Historical max drawdown: $3,155 per lot · Monthly income: $693/lot average · Win rate 80.6% · P/DD 11.32× · 612 trades. Capital sized to the Monte Carlo 95th-percentile drawdown ($3,717/lot). All figures net of commissions.
| Lots | Annual Net | Monthly | 10% Min Capital | 15% Min Capital | 20% Min Capital | 25% Min Capital | 30% Min Capital |
|---|---|---|---|---|---|---|---|
| 1 lot | +$8,319 | $693 | $37,200 | $24,800 | $18,600 | $14,900 | $12,400 |
| 2 lots | +$16,637 | $1,386 | $74,400 | $49,600 | $37,200 | $29,800 | $24,800 |
| 3 lots | +$24,956 | $2,080 | $111,600 | $74,400 | $55,800 | $44,700 | $37,200 |
| 4 lots | +$33,274 | $2,773 | $148,800 | $99,200 | $74,400 | $59,600 | $49,600 |
| 5 lots | +$41,593 | $3,466 | $186,000 | $124,000 | $93,000 | $74,500 | $62,000 |
| 6 lots | +$49,911 | $4,159 | $223,200 | $148,800 | $111,600 | $89,400 | $74,400 |
| 8 lots | +$66,548 | $5,546 | $297,600 | $198,400 | $148,800 | $119,200 | $99,200 |
| 10 lots | +$83,185 | $6,932 | $372,000 | $248,000 | $186,000 | $149,000 | $124,000 |
| Return on min capital | 22.4% | 33.5% | 44.7% | 55.8% | 67.1% | ||
High Income trades 6 spreads at $10 wide — more premium per signal and a lower full-max-loss rate (the $10 long wing sits further out, so price must travel further past the short strike in 9 minutes to reach full loss), at the cost of more capital per lot. Best suited to larger or income-focused accounts. Same signal, same 15:51 entry, same zero-management hold.
Compounded vs Uncompounded Growth Backtested · Illustrative
Every figure below is computed from the 513-trade backtest, May 2022 – July 2026, net of commissions. The curves illustrate how the edge would have compounded under different reinvestment rules — they are modeled projections on backtested trades, not a realized trading record.
Uncompounded holds one lot flat throughout. Compounded adds lots as capital accumulates — shown two ways: a conservative baseline sized to the Monte Carlo 95th-percentile drawdown, and a graduated schedule that starts with a smaller cushion to accelerate a small account.
$9,623 → $31,431
$9,623 → $56,479 · 15% max DD
$6,622 → $84,624 · 16% max DD
Compounding is a mathematical demonstration of capital efficiency, not a guarantee. We recommend starting uncompounded at a fixed lot size until the execution rhythm is second nature — then scale only when the account can carry it.
Each lot is funded at $9,623 per lot — the Monte Carlo 95th-percentile drawdown ($2,406) carried at a 25% tolerance, the same conservative basis as the account-sizing table above. A new lot would be added only when accumulated capital fully supports it, and lots reduced symmetrically if capital pulled back. Across the four-year backtest this would have grown $9,623 to $56,479 (+$46,856 net), reaching 6 lots, with a peak drawdown of just $9,934 (15%). One sentence to explain, nothing to defend.
This approach sizes more aggressively while the account is small — where a drawdown is easily absorbed — funding the first five lots at $6,622 each, then scaling the per-lot requirement up to the full $9,623 per-lot cushion by the tenth lot and holding there, with the same symmetric de-risking. Across the backtest this would have grown $6,622 to $84,624 (+$78,002 net), reaching 9 lots, with a peak drawdown of $15,942 (16%). More growth, modestly more risk — engaged only once the account is large enough to carry it.
A note on compounding: the compounded curves reflect the actual historical order in which the 513 trades occurred. Because each trade is sized on the capital available at that moment, a different sequence of the same trades would produce a different endpoint — compounding amplifies order. The uncompounded +$21,808 is order-independent and is the figure used everywhere else on this page. The compounded results illustrate how the edge scales under each sizing method; they are not guarantees. Tachyon is a new strategy; no compounded result shown here has been realized in live trading. All figures net of commissions.
How Tachyon Defeats the "Tail Risk" Problem
Most premium-selling systems carry unlimited tail risk — a naked or undefined position can give back months of gains in a single gap. Tachyon can't: every trade is a defined-risk spread, so the worst case is capped at the wing width minus the credit, known before you enter. No overnight gap can exceed it.
Zero Overnight or Weekend Risk
Trades execute at 15:51 ET and auto-settle cash into the 16:00 ET close. You are 100% flat overnight. Morning gap risk does not exist.
Systematic Skip-Day Logic
The system sits out days that don't favor the trade — every Monday (which tested poorly across four years) and any day with extreme end-of-day momentum, a fast one-way tape. And if the condor can't be sold for the minimum credit, there's no trade. No signal, no position.
Compressed 9-Minute Exposure
The position exists for about nine minutes — entered at 15:51 ET, cash-settled at 16:00. There's no time for a multi-hour trend or an overnight headline to develop against you, and the defined-risk structure caps the loss regardless.
Recent Trades · Standard Tier
File ref: condor_trades_Standard_v26...| Trade ID | Date Execution | Type | Credit | Net Profit |
|---|---|---|---|---|
| Loading latest trades… | ||||
The eight most recent trades from the published backtest, loaded from the same dataset that feeds the charts above.
Why I Built Tachyon
I've been writing code since 1974 — and trading options since 1982. I'm a retired U.S. Air Force pilot and instructor, so I design trading systems the same way I approached flight safety: strict checklists, objective parameters, and no manual guesswork.
Tachyon came out of years of building and testing my own futures and options strategies. I wanted an end-of-day process that didn't require sitting in front of screens all day watching deltas tick — one signal, a nine-minute hold, cash-settled at the close. I trade it on my own accounts Tuesday through Friday, from the same spreadsheet subscribers use.
Tachyon is new — live since late May 2026 — so most of what you see on this page is rigorously backtested rather than a long live record. I'd rather show you that honestly than dress it up. The research is real, the validation is independent, and the daily process is the same one I run myself.
What You Get
Tachyon Trade Alerts
Phoenix Trade Alerts
The Execution Engine
Frequently Asked Questions
What do I need to trade Tachyon?
Two things: a brokerage account approved to sell defined-risk option spreads (iron condors / vertical credit spreads) on SPX, and Slack to receive the alerts. The included Condor Selector spreadsheet handles the strike selection and builds the order for you — there's nothing else to install.
Which broker do you recommend?
Schwab / thinkorswim. The Condor Selector spreadsheet is built around thinkorswim — it generates the order string you paste straight into the platform, which is what makes the workflow a five-second click. Any broker that trades SPX 0DTE spreads will work, but on others you'd build the order by hand; the copy-and-paste convenience is tuned for thinkorswim today.
How are the alerts delivered?
Through a private members' Slack channel. The 15:45 ET pre-alert and the 15:51 ET confirmed signal both post there, so you'll need Slack (it's free, on phone or desktop). Slack is the only delivery method right now — you place the order yourself in your broker. Direct broker automation is on the roadmap but not live yet, so for now this is a signal you act on, not a system that trades your account.
What options approval level do I need?
Enough to sell defined-risk spreads — at most brokers that's the spread / "level 2"-type tier. You are never selling naked options; every position is a capped-risk condor. If your account can already sell a vertical credit spread, you can trade Tachyon. Approval levels and names vary by broker, so confirm yours directly — this isn't individual advice.
How much capital do I need to start?
It depends on your lot size and how much drawdown you're willing to tolerate — see the Account Sizing tables above for the full grid. As a conservative floor, capital is sized to the Monte Carlo 95th-percentile drawdown (about $2,406 per lot) divided by your chosen drawdown tolerance, so a 25% tolerance puts one lot around $9,623. One lot is a realistic place to start; scale only once the account comfortably carries it.
What if I miss the 15:51 alert, or can't trade that day?
Nothing bad happens — there's no position until you place one. The strategy already sits out most days (Mondays always, plus any day conditions don't line up), so missing one is just one more skipped day among many. The edge shows up over a rolling window of trades, not on any single afternoon, so don't chase a missed entry.
Can I try it before trading real money?
Yes — paper-trading the live alerts in thinkorswim for a couple of weeks is the best way to get the rhythm down risk-free, and it's exactly what I'd suggest before going live. The monthly plan is also there as a low-commitment way to follow along; you can cancel anytime. There's no separate free trial.
What's the worst it has done?
Losing days and losing weeks happen — you can see one in the recent-trades log above. Across the four-year backtest the worst peak-to-trough drawdown was about $1,656 per lot, and the stress-tested 95th-percentile figure used for account sizing is $2,406. Every position is a defined-risk spread, so the loss on any single day is capped before you enter — a bad day is a known, survivable number, never an open-ended hole. Read the performance disclaimer above before relying on any of these figures.
Do you trade it yourself?
Yes, on my own accounts, Tuesday through Friday — from the same spreadsheet and the same Slack alerts you'd get. The live trade walked through above is one of mine.
Can I trade it from outside the U.S. or around a day job?
Yes — that's much of the appeal. It's one scheduled decision at 15:51 ET with no chart-watching: you need about ten minutes around the U.S. close to read the alert and place the order. Plenty of subscribers fit it around a full-time job or a non-U.S. time zone. If those minutes don't work for you, paper-trade it until automation is available.
Is this guaranteed income?
No. Tachyon is a signal service built on a backtested edge, not an annuity, a managed account, or investment advice. Some months will lose, and past results — backtested or live — don't guarantee future ones. Trade only with capital you can afford to lose, and make your own decisions on every trade.
How do I cancel?
Anytime, from your account — there's no lock-in. Your access runs through the end of the billing period you've already paid for.
One short, scheduled trading window at the end of the day.
Select Your Membership Plan
Your subscription completely unlocks real-time setups for both execution models on private Slack channels. Choose the billing interval that fits your scaling goals.
Secure access integration mapped directly to the intervals displayed in image_1503fe.png. Cancel anytime.