
Automated Futures Trading.
Validated. Not Curve-Fit.
A statistically robust mean-reversion strategy for Nasdaq and S&P futures. Built and validated on NQ — ES included as a bonus instrument. Live on NQ, MNQ, ES, and MES.
Built on NQ. Works on ES too.
Phoenix was developed and validated entirely on NQ. ES is not a separate product — it’s independent confirmation the edge is real. One subscription covers all four instruments in NinjaTrader 8.
NQ & MNQ
- $4,135/month average profit
- ~1.7 trades/day average
- $17,611 max drawdown
- MNQ ideal for prop firm evals
- 7 of 7 calendar years profitable — 100%
- 100% of all 12-month windows profitable
ES & MES
- $1,748/month average profit
- ~1.4 trades/day average
- $16,365 max drawdown
- MES ideal for smaller accounts
- 7 of 7 calendar years profitable — 100%
- Works without reoptimization — genuine robustness signal
Why ES working matters: Phoenix was built and optimized entirely on NQ data. ES signals are not a separate product — they’re a byproduct of genuine robustness. When a strategy works on a correlated but distinct instrument it was never trained on, that’s independent confirmation the edge is real, not curve-fit.
Both instruments included in one subscription. Jan 2020 – May 2026 with commissions applied.
Phoenix vs. Buy & Hold NQ
“Why not just buy QQQ?” — Because this is what controlled drawdown looks like versus riding the full volatility of the market. Same instrument. Very different ride.
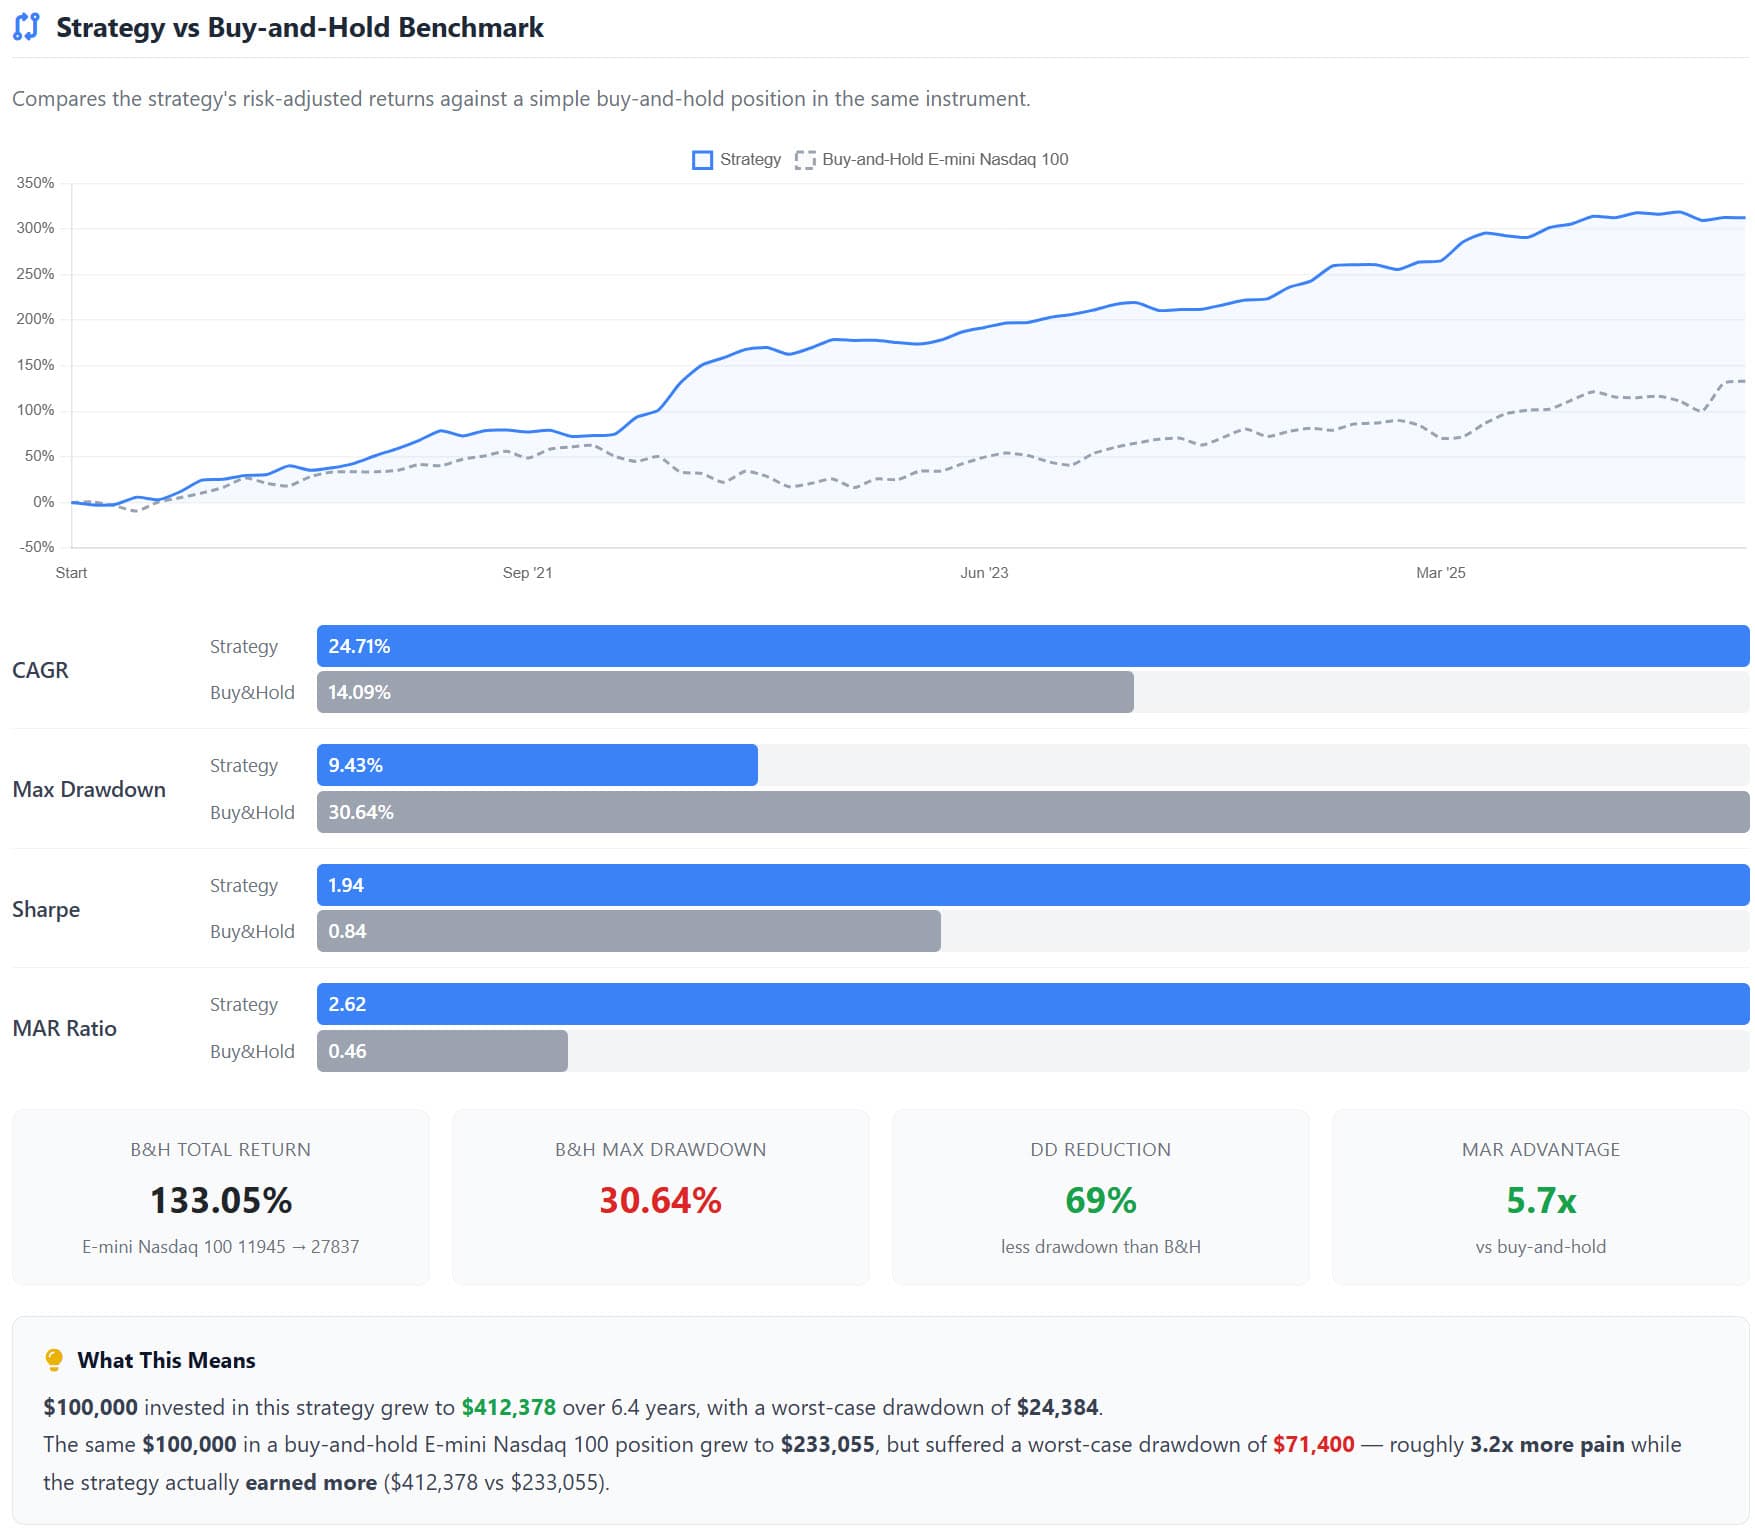
$100,000 Starting Balance — 6.4 Years
Phoenix grew the same $100K to $418,428 — with a worst-case drawdown of just $17,611. Buy-and-hold grew to $245,634 but suffered a $75,254 drawdown — roughly 3.2× more pain while earning less.
Buy-and-hold NQ returned strong gains from 2020–2026 — but required sitting through a 30.64% drawdown with no income and no certainty of recovery. Phoenix stayed profitable every single year, including a +$99,282 best year in 2022 when buy-and-hold fell 30%+. For prop firm traders with trailing drawdown limits, the comparison isn’t even close. Only 2.3% of Phoenix’s returns are explained by market direction — this is genuine alpha, not leveraged NQ exposure.
Drawdown Duration Chart
It’s not just how deep drawdowns go — it’s how long they last. Short, shallow, fast-recovering drawdowns are what keep prop traders funded.
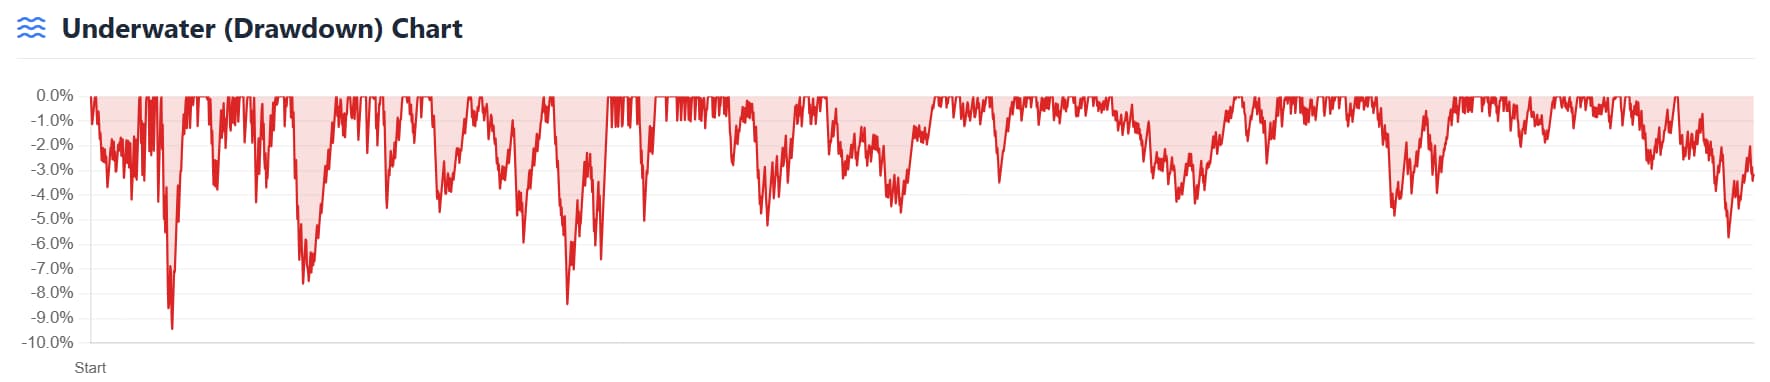
MAR ratio of 2.65 means CAGR is 2.65× the max drawdown percentage. Short drawdown periods mean less time trading scared and more time compounding.
Seen enough? Start trading with a validated edge.
One subscription covers NQ, MNQ, ES, and MES in NinjaTrader 8.
Why Most Prop Traders Fail (And How Phoenix Helps)
Passing evaluations is not about finding the “perfect setup.” It is about avoiding predictable human mistakes.
Trying to Pass Too Fast
Most traders oversize because they want to finish the eval quickly. This increases variance and leads to blowups.
Phoenix Solution: High win rate and steady expectancy support patient, low-stress sizing.
Revenge Trading After Losses
One bad day turns into emotional trading and rule-breaking.
Phoenix Solution: Fully automated execution removes emotional decision-making entirely.
Trailing Drawdown Pressure
As the trailing drawdown rises, traders become fearful and inconsistent.
Phoenix Solution: Smooth equity curve (R² = 0.983) and max losing streak of just 5 trades reduces psychological stress.
Strategy Hopping
Traders abandon systems during normal drawdowns and chase the next idea.
Phoenix Solution: Six years of validated data and 100% of 12-month windows profitable builds confidence to stay the course.
Overtrading and Micromanaging
Too many discretionary trades slowly destroy the account.
Phoenix Solution: Rule-based entries and exits eliminate impulsive trades.
Underestimating Variance
Many traders quit during normal losing streaks they didn’t expect.
Phoenix Solution: Monte Carlo testing across 5,000 simulations shows realistic drawdown expectations upfront.
Prop Firm Evals Are Designed to Break You
If you have failed prop evaluations, you are not alone. Most traders fail not because their strategy doesn’t work, but because evaluation rules amplify normal human mistakes:
- Oversizing to pass fast — variance kills you
- One red day — revenge trading
- Trailing drawdown pressure — you start trading scared
- Up big early — give it back trying to finish the target
Phoenix is built for this environment: high sample size, statistically verified edge, and the ability to run an emotionless, repeatable process instead of hope trading.
Tom’s Experience With Prop Firm Evaluations
I blew more prop firm accounts than I care to admit over two years. Not because I lacked skill, but because I kept trading too big and trying to force fast passes.
Most of the time I was taking too much risk, chasing profit targets, and building bad habits just to get funded.
I did eventually succeed. But it was not easy. Those aggressive habits did not work once I was funded. I had to relearn patience and build systematic, rules-based ways of trading.
Phoenix was built to enforce those lessons automatically. I trade it every day on my own funded accounts.
Built for Robustness, Not Curve-Fitting
Phoenix was developed using Adaptrade Builder with rigorous in-sample/out-of-sample testing and Monte Carlo validation — across 6+ years of historical data. But we didn’t stop there. We then ran it through our comprehensive robustness testing suite to verify the edge holds up under real-world conditions on both NQ and ES.
The result: a strategy that remains profitable through dramatically different market conditions — the COVID crash, the 2021 bull run, the 2022 bear market, the volatile rate-hike environment of 2023–2024, and the 2025 AI rally — demonstrating genuine edge rather than over-optimization.
Why This Two-Stage Validation Matters
Most backtested strategies fail in live trading because they’re curve-fit to historical data. They look amazing on paper but fall apart when market conditions change.
Phoenix goes through two layers of validation across 6+ years of data. First, Adaptrade Builder uses in-sample/out-of-sample testing and Monte Carlo analysis during strategy development to prevent overfitting from the start. Then, our robustness testing suite subjects the finished strategy to additional statistical analysis, noise injection, stability tests, and E-Ratio calculations to verify the edge is real and durable.
6-Year Equity Curve (NQ)
$318,428 net profit — 2,626 trades — January 2020 through May 2026
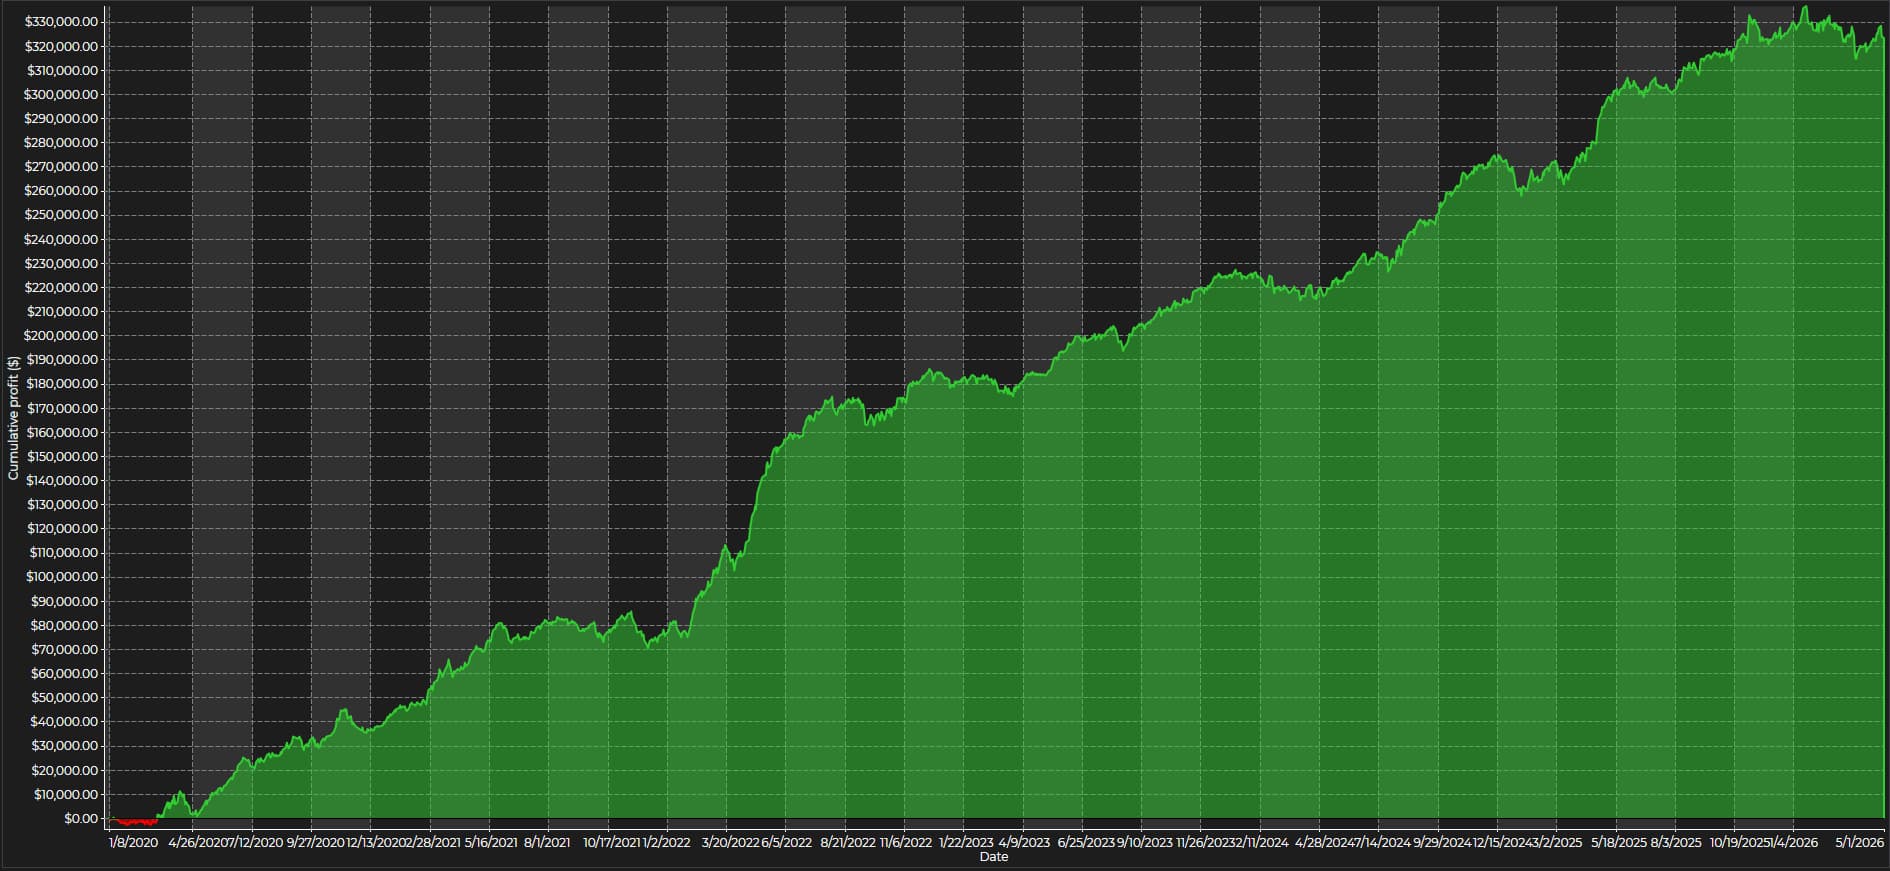
K-Ratio measures equity curve consistency. SQN (System Quality Number) measures edge quality. MAR = CAGR divided by maximum drawdown percentage. NQ only — Jan 2020 through May 2026.
Monthly Returns
77 months of performance. The pattern speaks for itself.
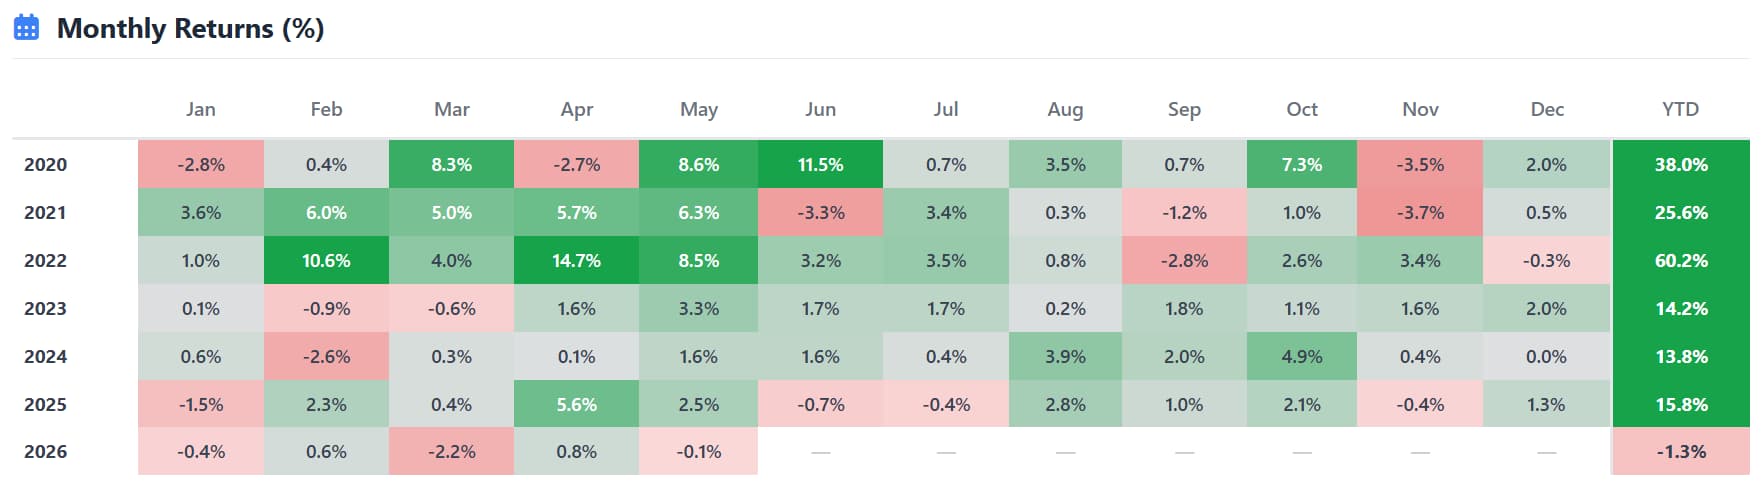
NQ — January 2020 through May 2026 — commissions included. Any trader who held Phoenix for 12 consecutive months made money — in all 66 possible windows.
7 of 7 Calendar Years Profitable — 100%
Every single calendar year green — including the 2022 bear market that crushed buy-and-hold by 30%+ and 2026 YTD despite extraordinary volatility.

2026 context: March 2026 was affected by extraordinary market volatility. Despite a challenging start, Phoenix recovered to finish the first 5 months of 2026 in positive territory — maintaining its perfect record of 7 profitable calendar years out of 7. Every trader who held Phoenix for any 12 consecutive months across the full dataset made money — 66 out of 66 possible windows.
Comprehensive Robustness Analysis
Every test Phoenix passed to earn our “TRADABLE” rating
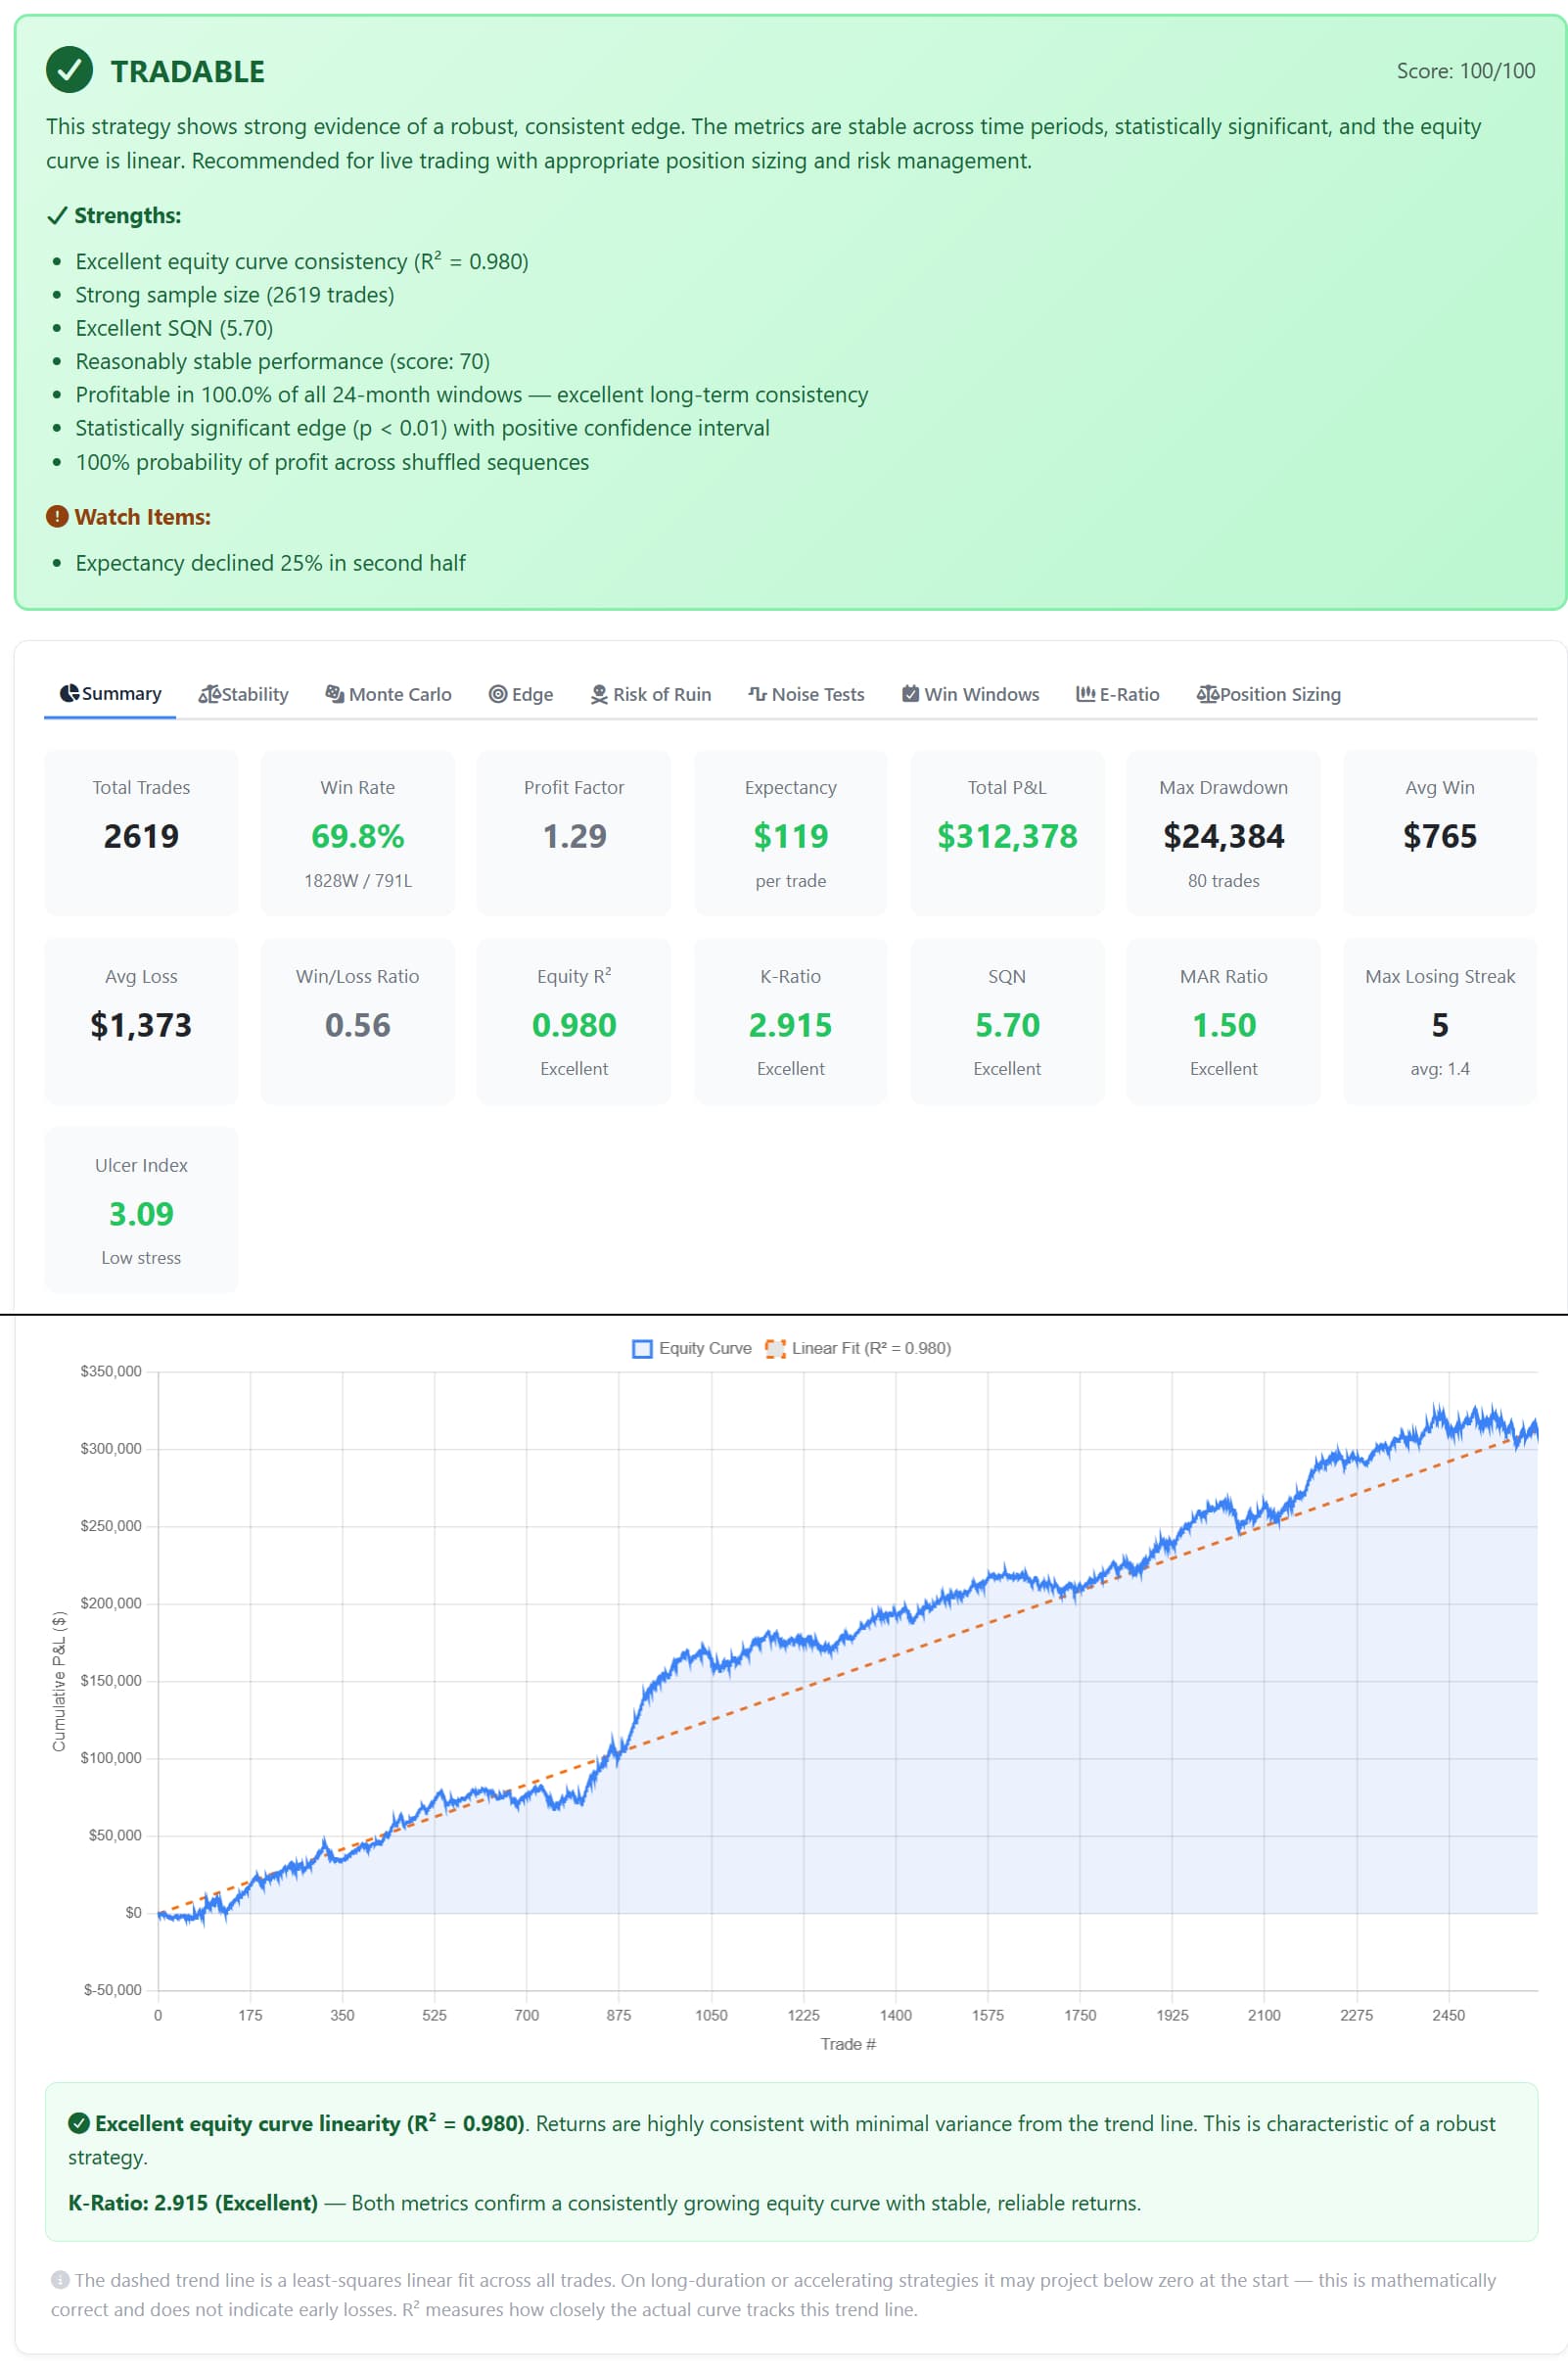
Overall Summary & Robustness Score
The Robustness Score (0–100) combines all individual tests into a single actionable metric. A score of 80+ indicates a likely tradeable strategy; 100 means it passed every major validation checkpoint.
Phoenix strengths from the report:
- Excellent equity curve consistency (R² = 0.983)
- Strong sample size (2,626 NQ trades)
- Excellent SQN score (5.85)
- Profitable in 100% of all 24-month windows
- Statistically significant edge (p < 0.001)
- 100% probability of profit across all shuffled trade sequences
Watch item: Expectancy declined 16% in second half ($131.94 → $110.58) — monitored; overall trend remains solidly positive.
Phoenix Result: 100/100 — TRADABLE
Stability Analysis (First Half vs Second Half)
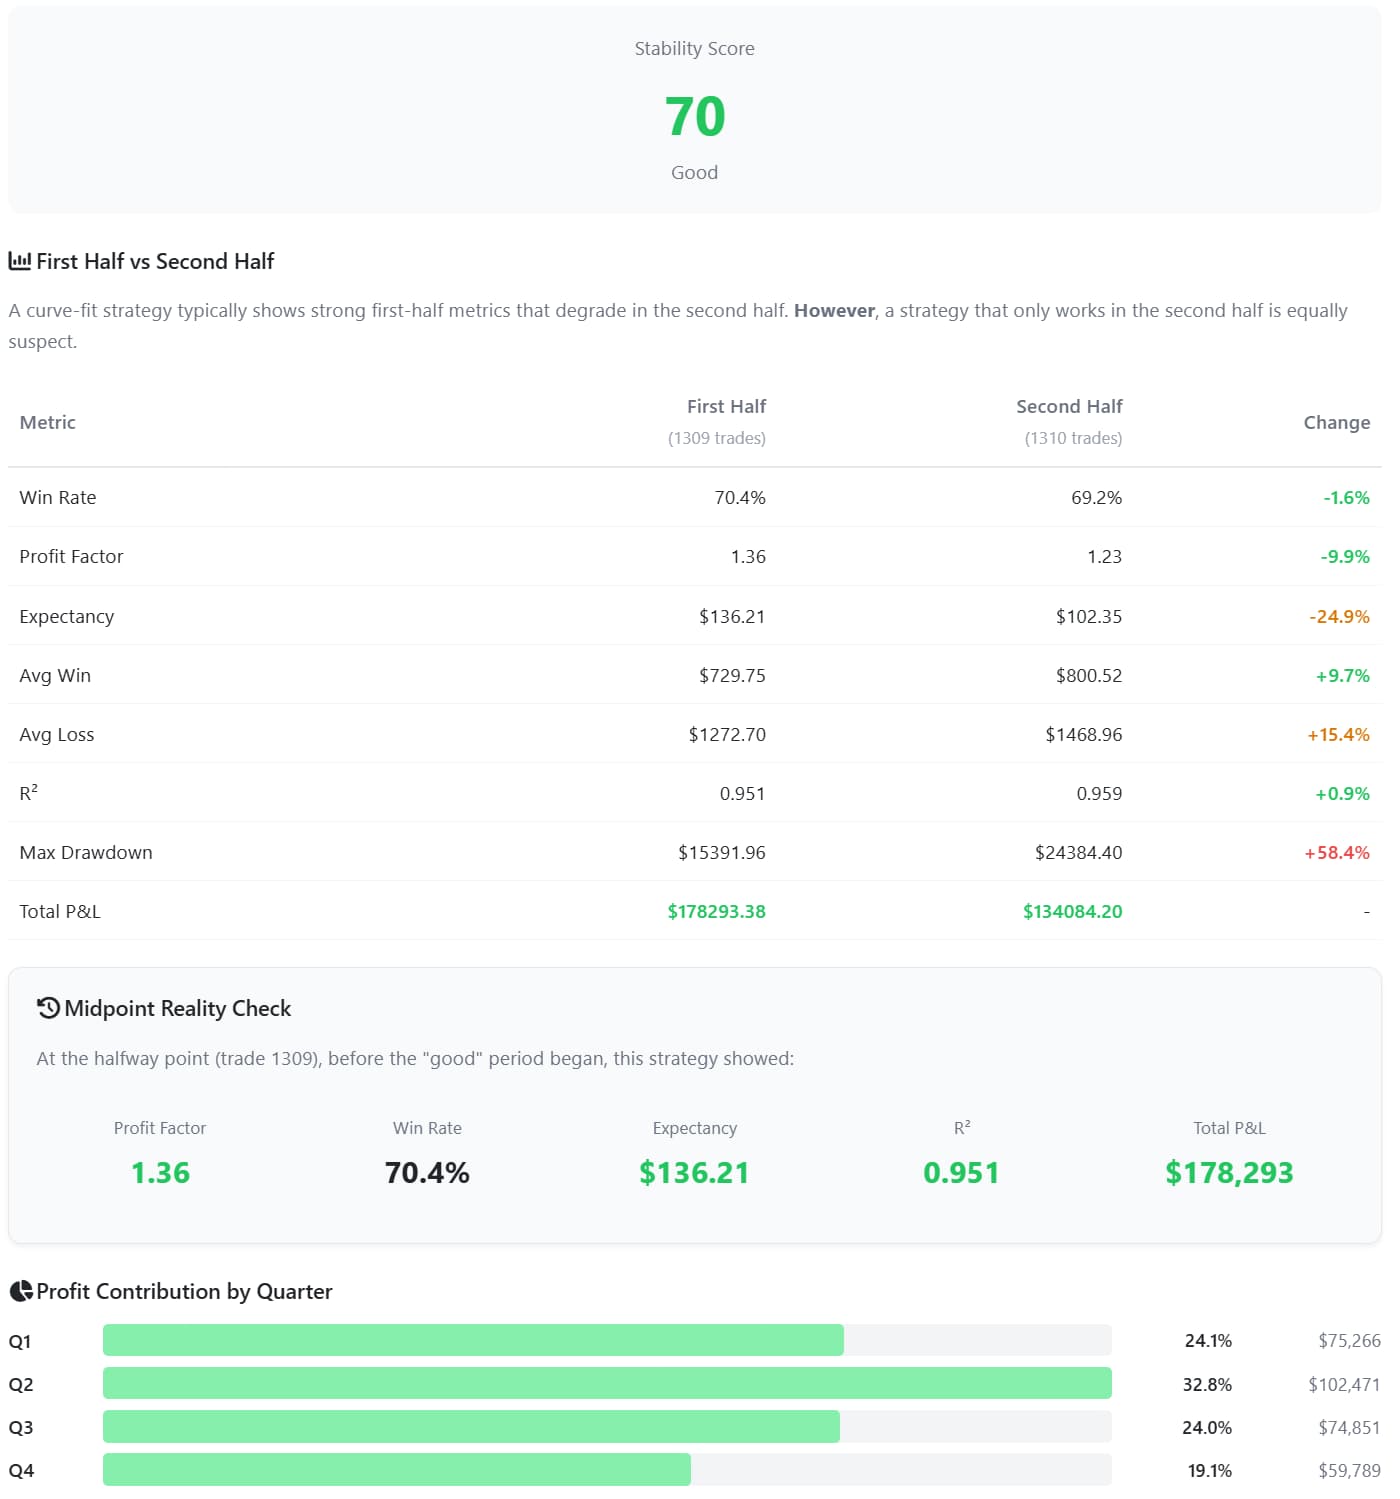
The Stability Score (0–100) measures how consistently the strategy performs across different time periods. We split the 2,626-trade backtest into two halves and compare key metrics.
Results:
- Win rate: 70.4% → 69.3% (−1.5% — minimal change)
- R²: 0.954 → 0.963 (improved in second half)
- 7 of 7 calendar years profitable — 100%
- Expectancy declined 16% ($131.94 → $110.58) — watch item, strategy is monitored
Phoenix Result: Stability Score: 70 (Good)
Monte Carlo Simulation
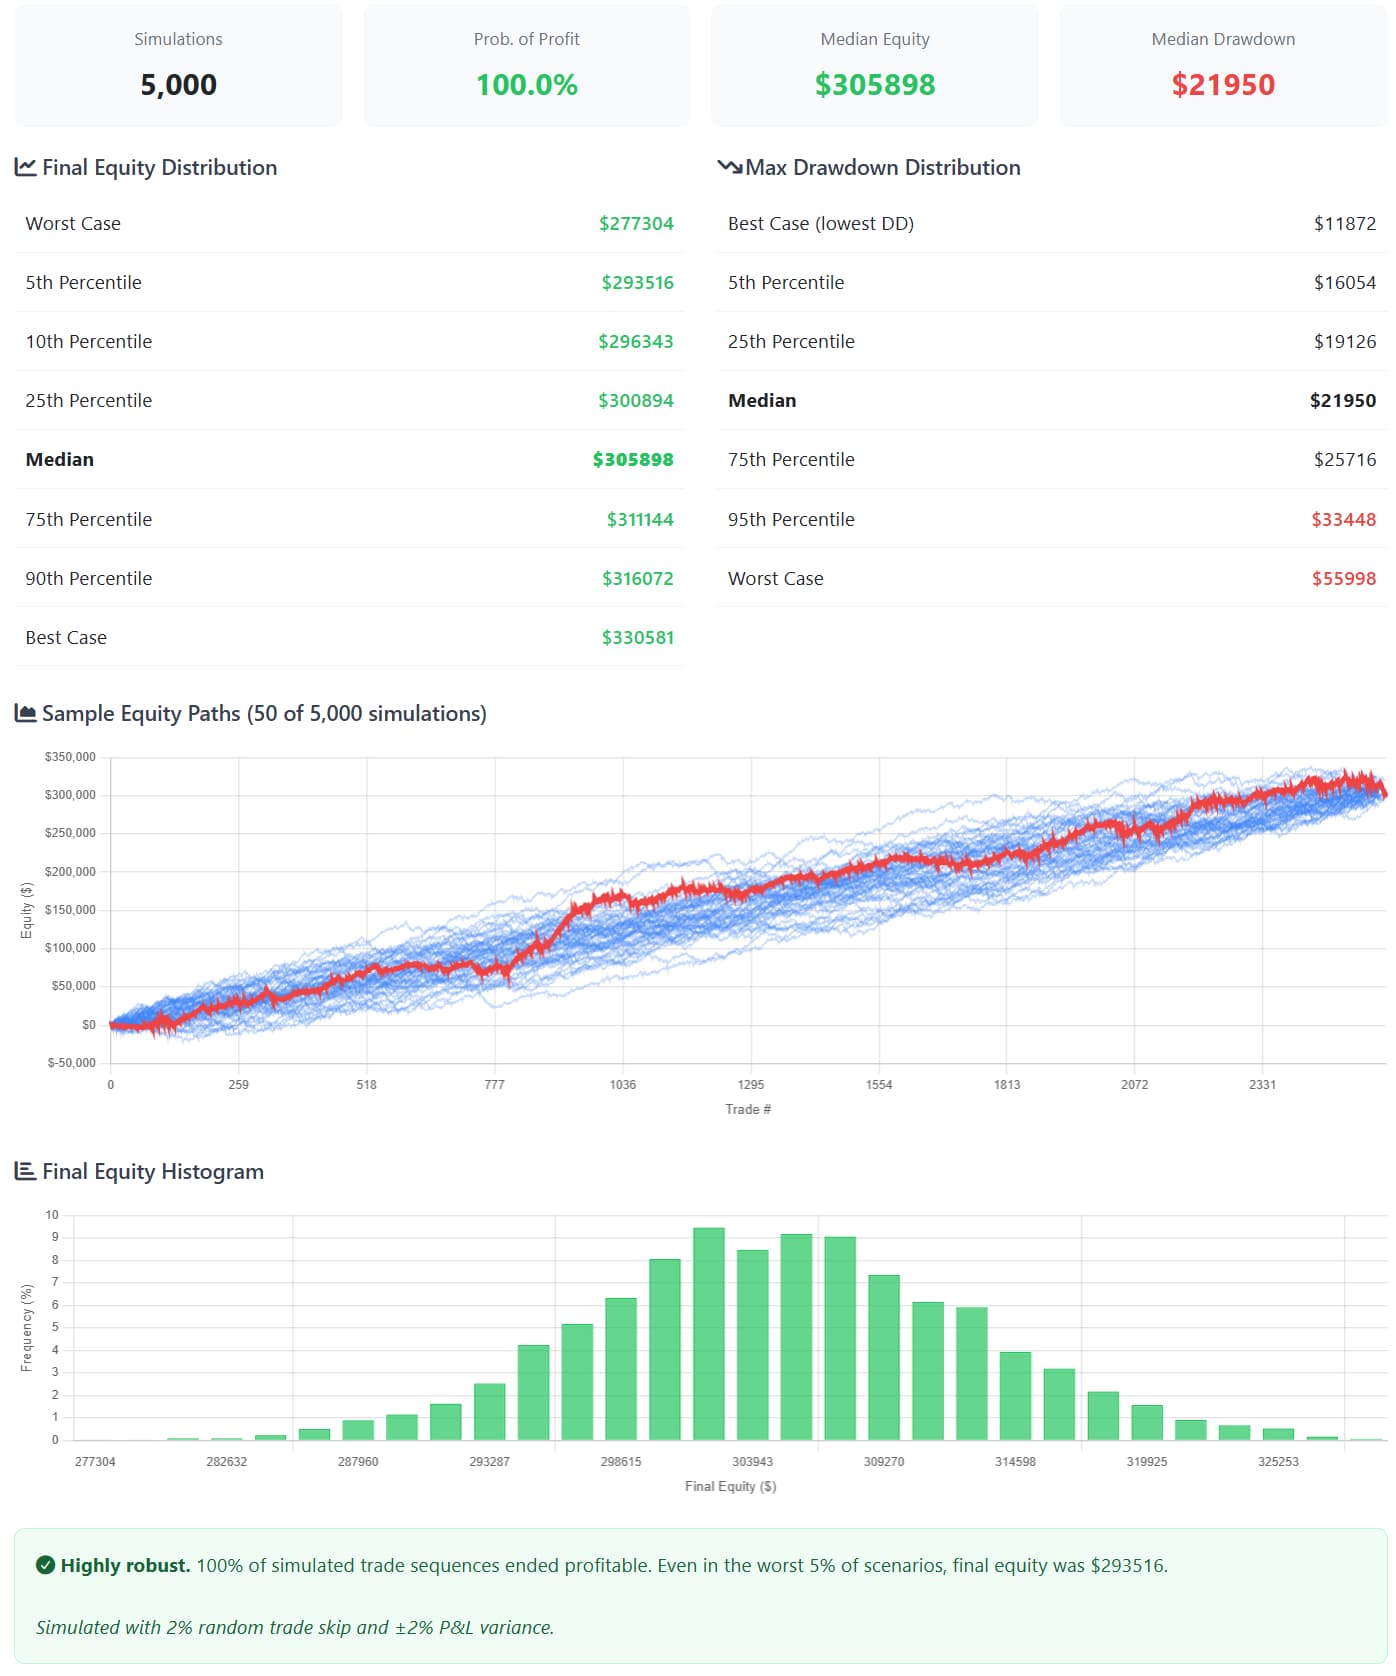
Monte Carlo analysis answers: “What if the trades happened in a different order?” We run 5,000 simulations, randomly shuffling trade sequences to understand the range of possible outcomes.
Results from 5,000 simulations:
- Probability of Profit: 100% — every sequence was profitable
- Median equity: $311,843
- Worst case equity: $286,797 — still solidly positive
- Median drawdown: $21,609
- 95th percentile drawdown: $32,275 — acceptable worst case
Phoenix Result: 100% Probability of Profit 5,000 Simulations
Statistical Edge Detection
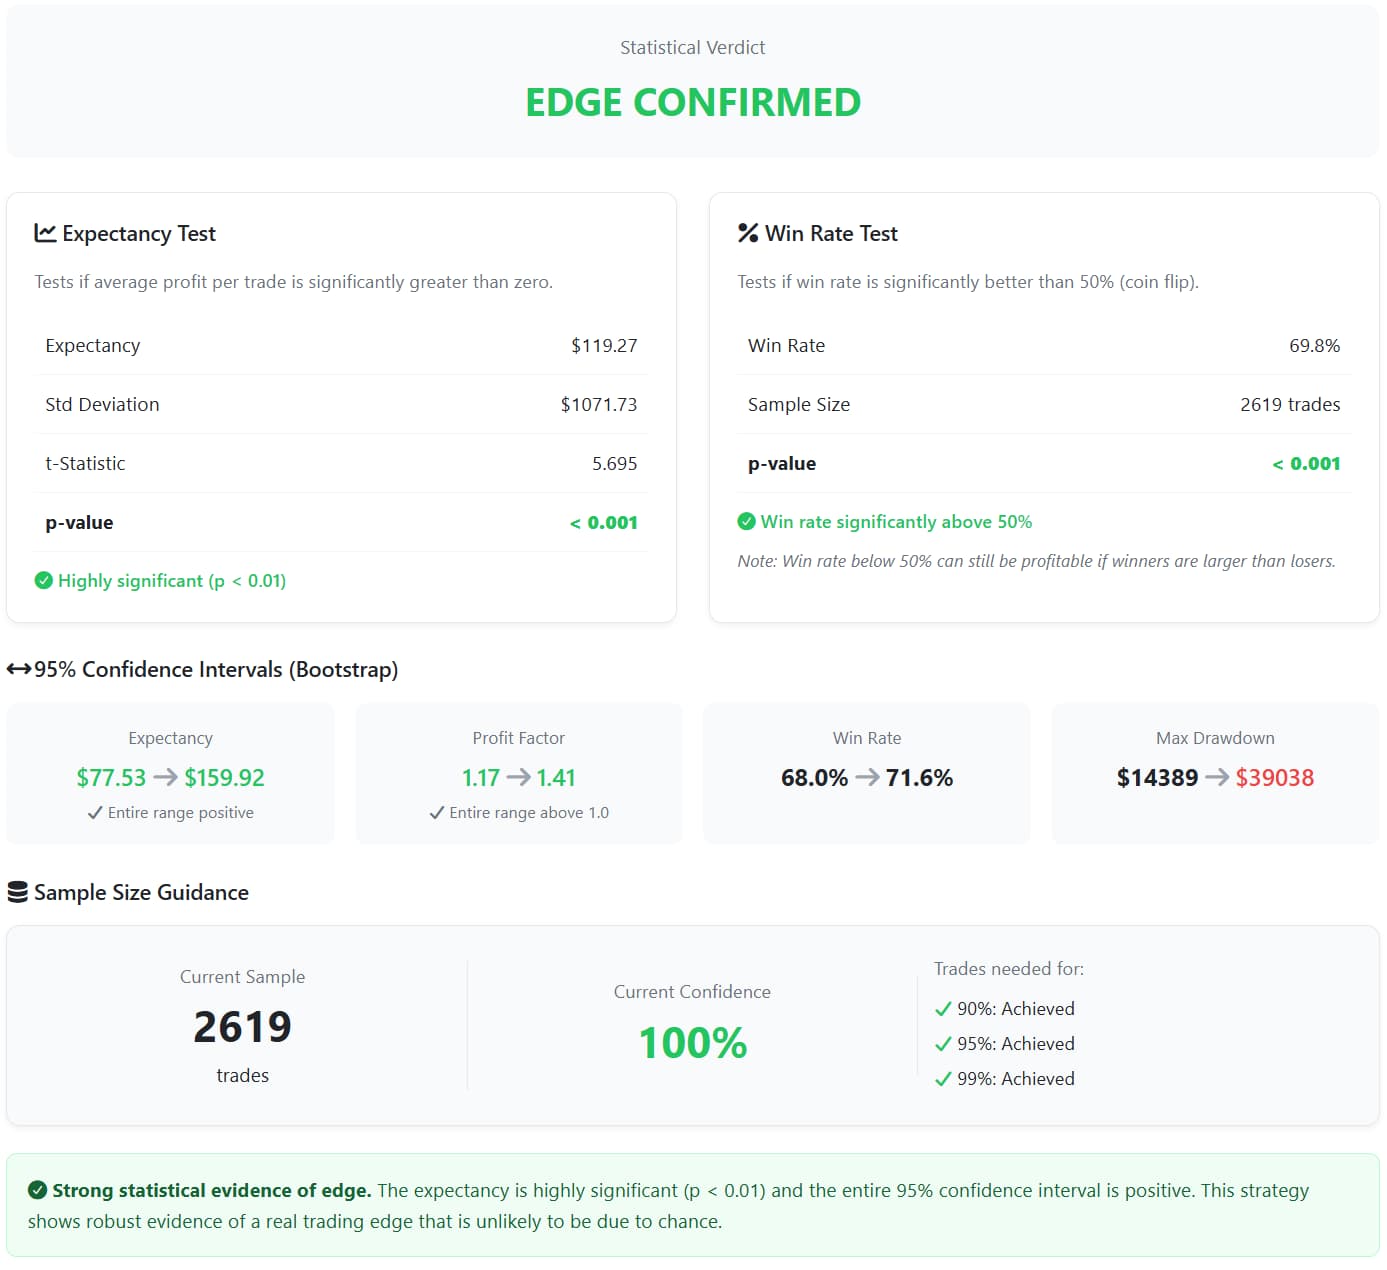
This test answers: “Is this edge real, or could these results have happened by chance?”
Results:
- p-value < 0.001 — highly significant
- 95% CI Expectancy: $78 → $163 — entire range positive
- 95% CI Profit Factor: 1.18 → 1.42 — entire range above 1.0
- 95% CI Win Rate: 68.0% → 71.6%
- Current confidence: 100% (90%, 95%, 99% all achieved)
Phoenix Result: EDGE CONFIRMED (p < 0.001)
Trade Quality Analysis (MAE/MFE)
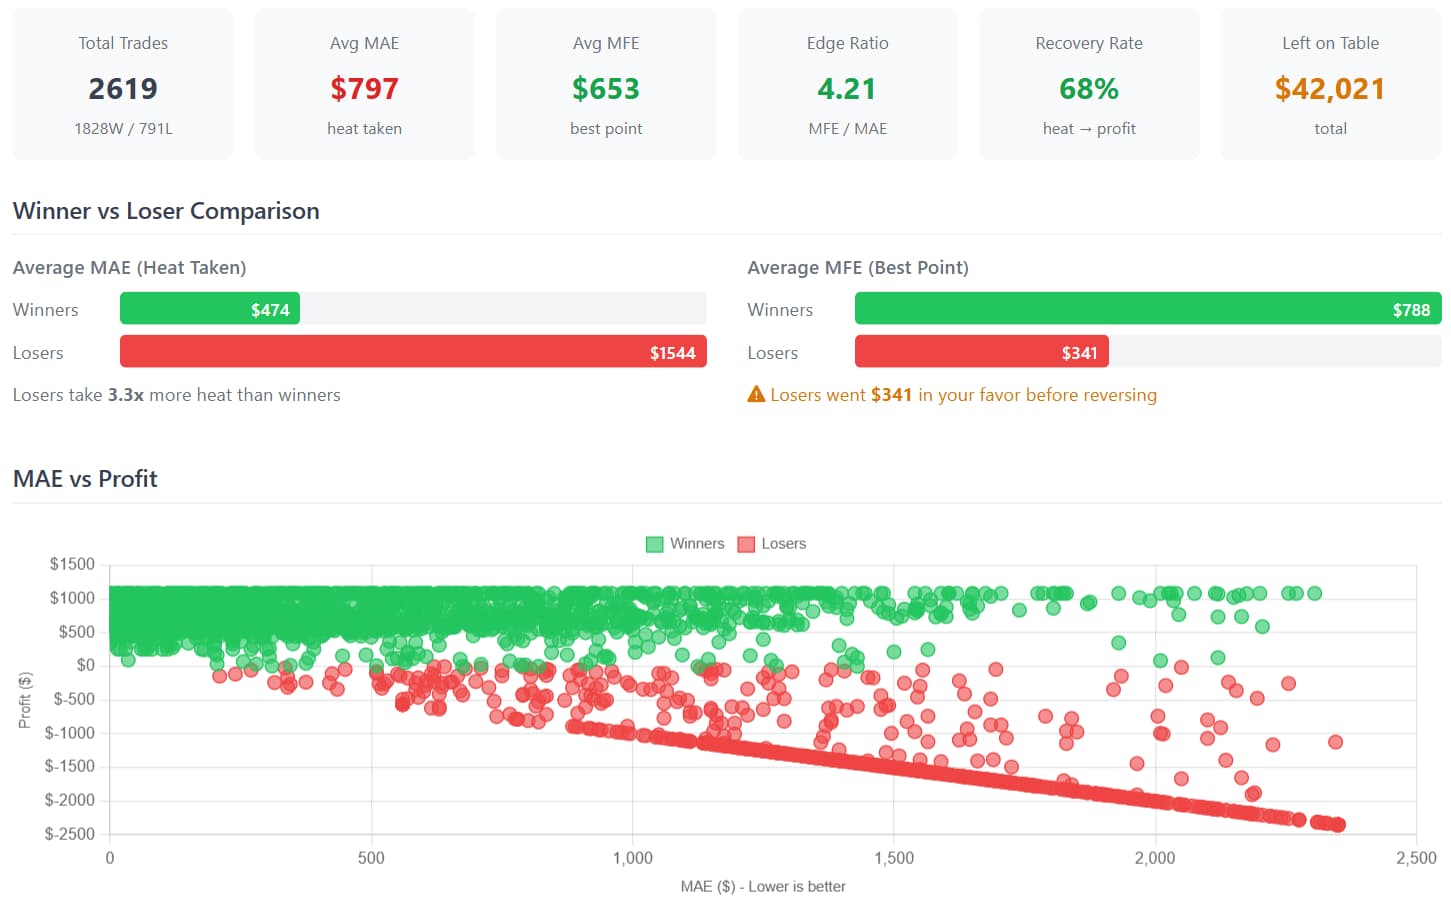
MAE (Maximum Adverse Excursion) and MFE (Maximum Favorable Excursion) analyze what happens during each trade, not just the final result.
- Avg Win: $761 • Avg Loss: $1,360
- Max Losing Streak: 5 (average 1.4)
- Ulcer Index: 3.10 — Low stress rating
- 68% of trades that go negative recover to profit
Phoenix Result: Edge Ratio: 4.21 Ulcer Index: 3.10 (Low Stress)
Noise & Slippage Tests
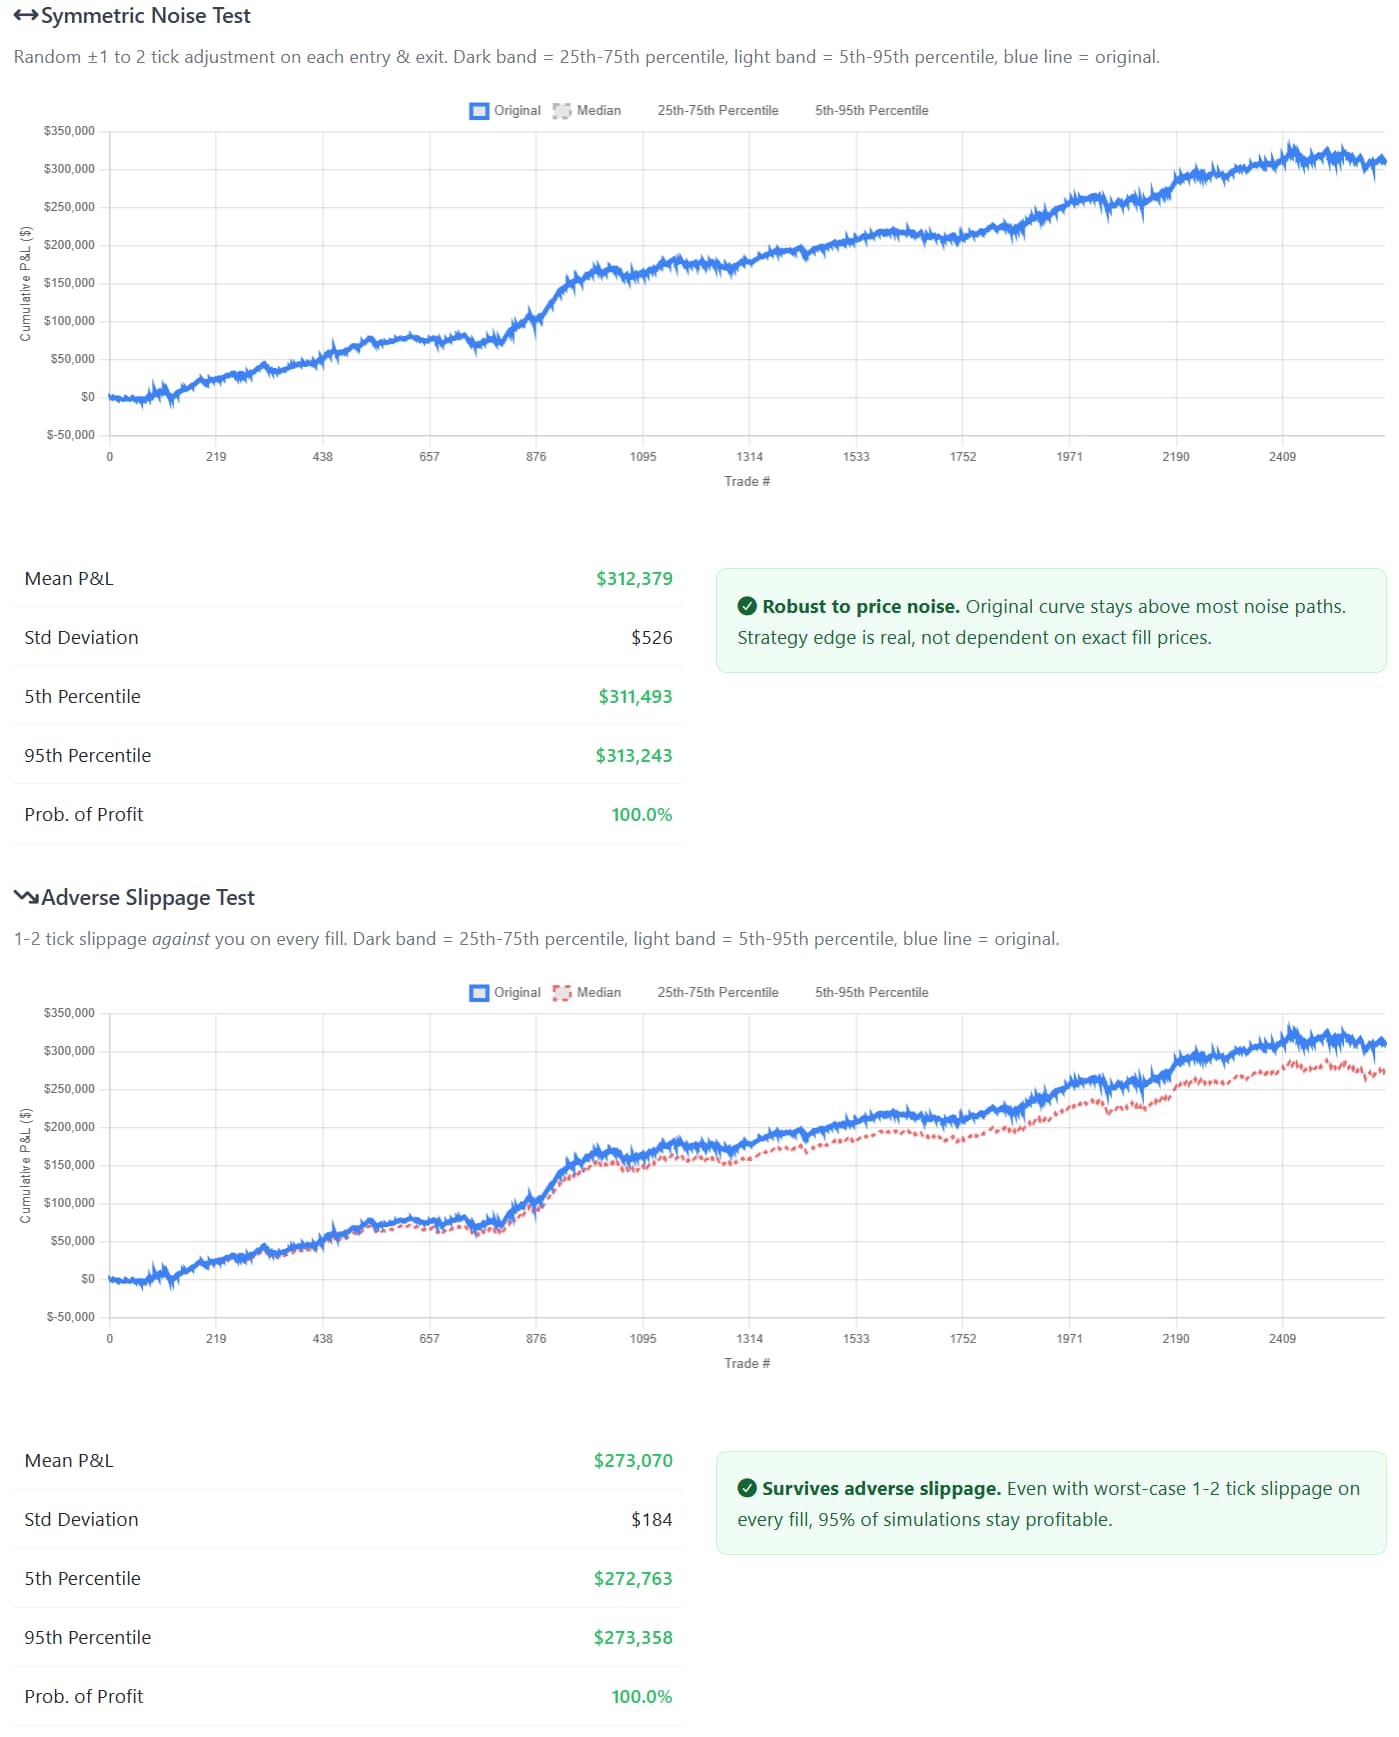
Real trading involves slippage. These tests simulate random price variations to see if the strategy survives real-world execution.
- Symmetric Noise Test: 100% profit probability, mean P&L $318,455
- Adverse Slippage Test: 100% profit probability even with worst-case 1–2 tick slippage on every single fill
- Adverse case mean P&L: $279,047 — still strongly profitable
Phoenix Result: Robust to Price Noise Survives Adverse Slippage
Edge Ratio (E-Ratio)
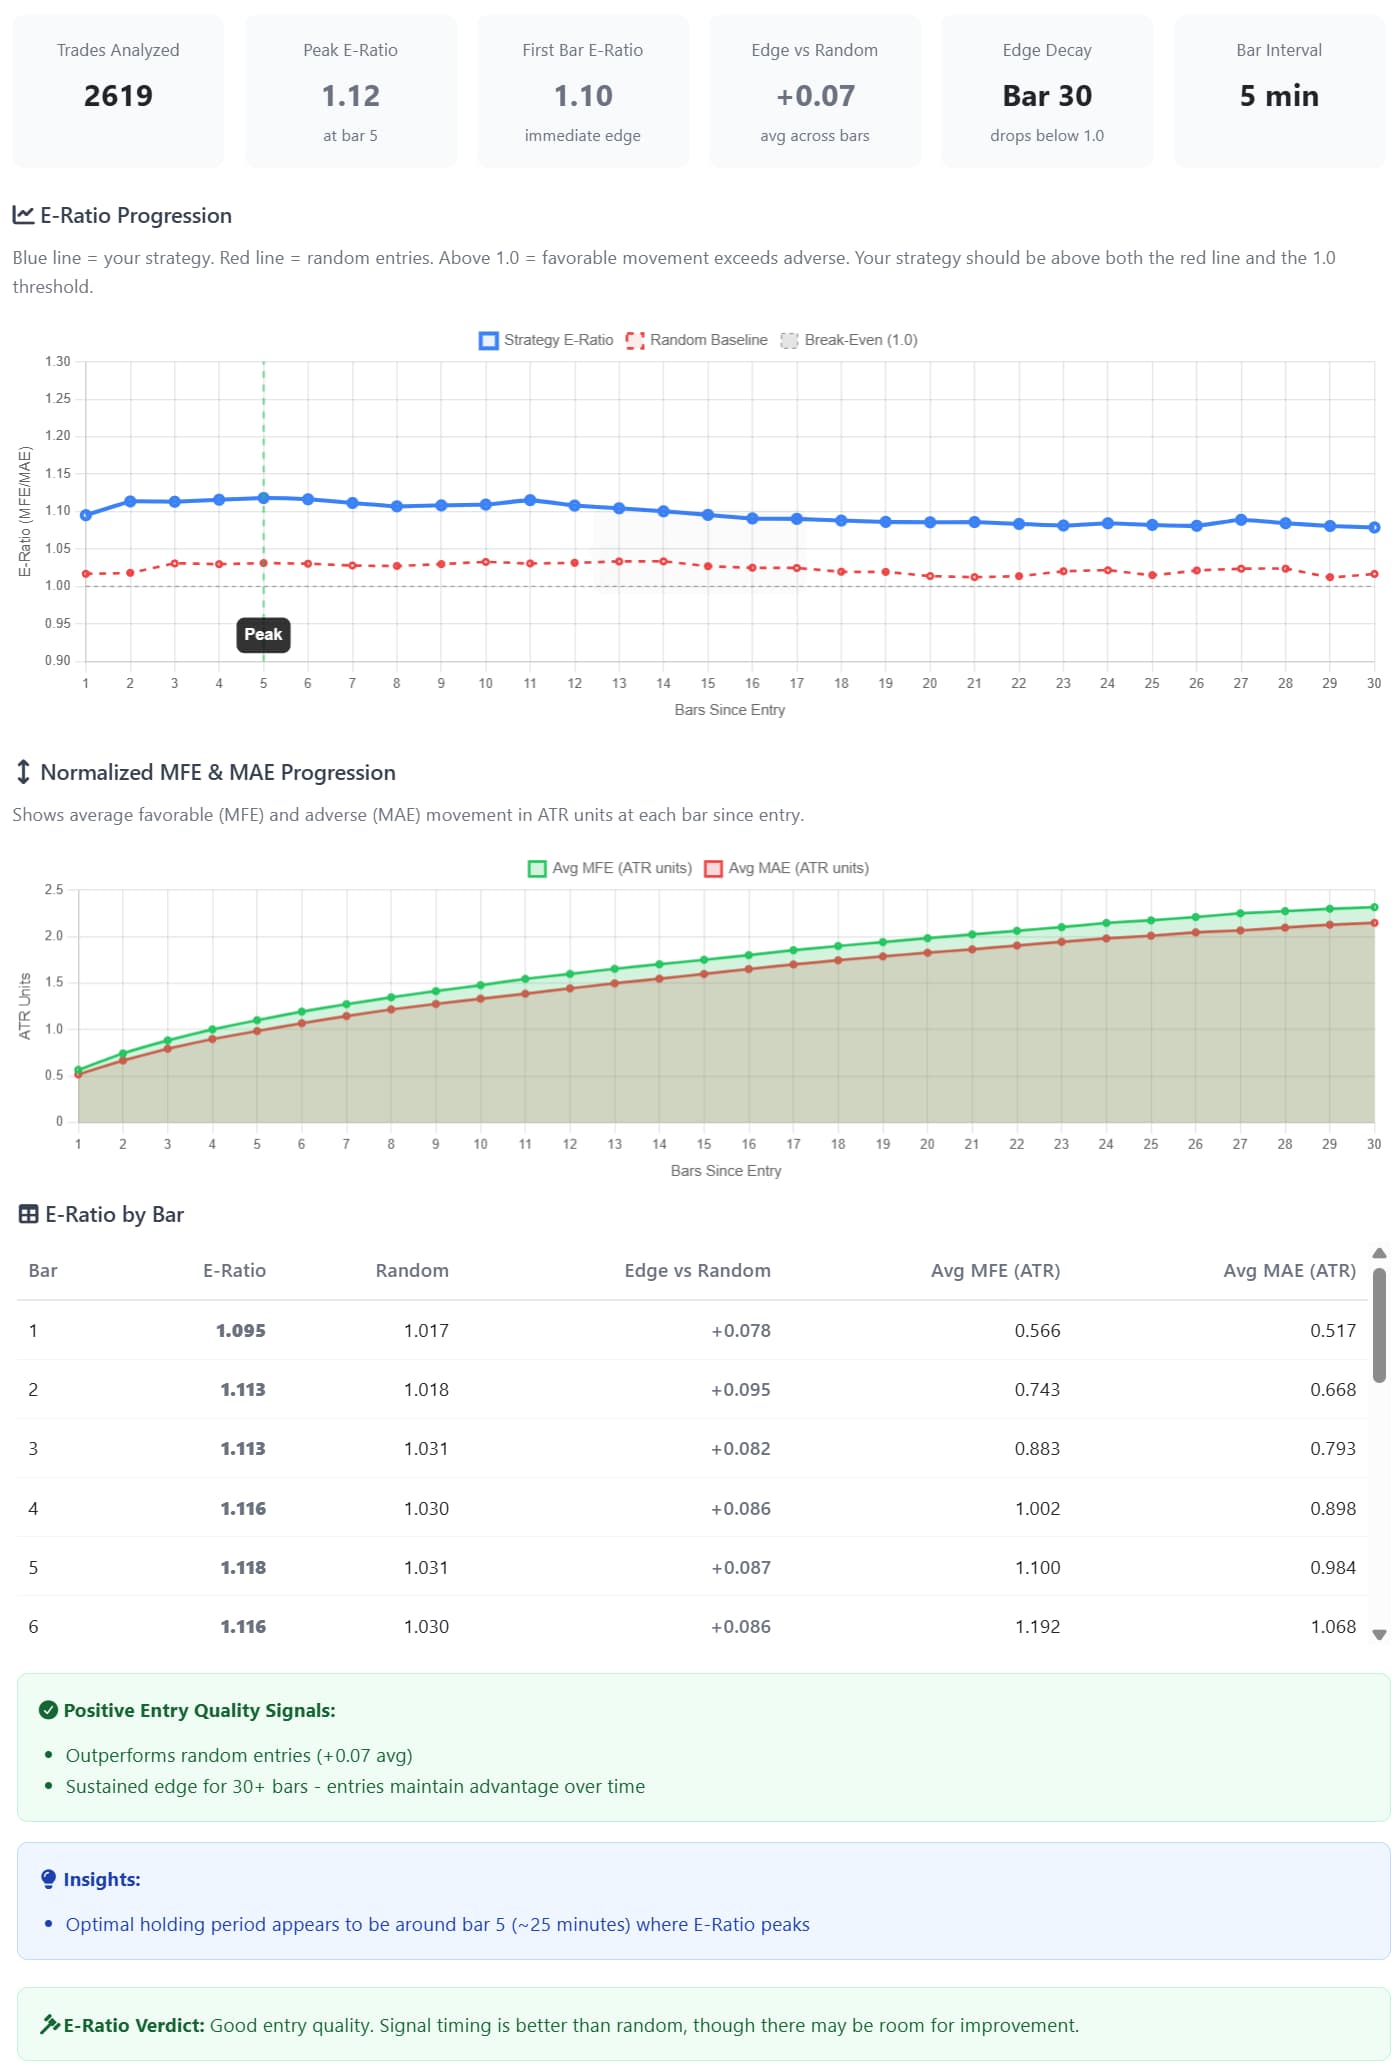
The E-Ratio measures whether entry signals are better than random by comparing favorable versus adverse movement after entry.
Results from 2,626 trades:
- Peak E-Ratio: 1.12 at bar 5 — immediate edge confirmed
- First Bar E-Ratio: 1.09 — edge present from bar 1
- Edge vs Random: +0.12 average across all bars
- Stays above 1.0 through bar 30 — persistent, durable edge
Phoenix Result: Peak E-Ratio: 1.12 (Entry Edge Confirmed)
Prop Firm Evaluation Performance
Phoenix is ideal for prop firm evaluations — here’s the data to prove it
We simulated 5,000 evaluations per configuration using Phoenix with standard $50K account rules ($3,000 profit target, $2,500 trailing drawdown). The results show Phoenix delivers consistent, profitable performance ideal for prop firm trading.
A Simple, Low-Stress Path to Funded
Most prop traders fail because they try to pass too fast. Phoenix works best when you let probability do the heavy lifting.
Pass Rates by Contract Size (MNQ)
| Contracts | Pass Rate | Median Trades to Pass | Risk Level | Best For |
|---|---|---|---|---|
| 1 Contract | 32.1% | 154 trades | Minimal | Ultra-conservative / Learning |
| 2 Contracts | 70.4% | 88 trades | Low | Best Pass Rate — Recommended Start |
| 3 Contracts | 65.9% | 49 trades | Moderate | Fastest to Funded — Sweet Spot |
| 4 Contracts | 59.3% | 30 trades | Medium | Aggressive / Experienced |
| 5 Contracts | 56.3% | 21 trades | Higher | Very Aggressive |
Based on 5,000 simulated evaluations per configuration using 6+ years of Phoenix M5 trade data.
Evaluation Cost Analysis
| At 2 contracts (best pass rate): | |
| Pass Rate | 70.4% |
| Evals Needed for 20 Passes | ~29 evals |
| Total Eval Cost ($25 each with coupon) | ~$725 |
| Cost per Funded Account | ~$36 |
| At 3 contracts (fastest to funded): | |
| Pass Rate | 65.9% |
| Evals Needed for 20 Passes | ~31 evals |
| Total Eval Cost ($25 each with coupon) | ~$775 |
| Cost per Funded Account | ~$39 |
What Passing Gets You
| Each passed evaluation earns you: | |
| Funded Account Access | $50K account |
| Profit Split | 80–90% to you |
| First Withdrawal Target | ~$4,000–$4,600 |
| Funded accounts should be traded conservatively (1–2 contracts) to protect your position. | |
Time to 20 Funded Accounts (Running 20 Evals in Parallel)
| Contracts | Pass Rate | Median Trades | Evals Needed | Est. Days | Time to 20 Funded | Eval Cost |
|---|---|---|---|---|---|---|
| 1 | 32.1% | 154 | 63 | 353 | 11.8 mo | $5,650 |
| 2 | 70.4% | 88 | 29 | 93 | 3.1 mo | $1,333 |
| 3 | 65.9% | 49 | 31 | 56 | 1.9 mo | $707 |
| 4 | 59.3% | 30 | 34 | 38 | 1.3 mo | $680 |
| 5 | 56.3% | 21 | 36 | 29 | 29 days | $720 |
Eval Cost assumes typical APEX pricing with coupon, 20 evaluations run simultaneously.
Conversion fees not included: add approximately $3,000 for activation fees ($150 × 20 accounts).
Pro Tip: Stagger Your Accounts for Risk Management
Running multiple accounts? Stagger your start dates to reduce the risk of all accounts failing together during a drawdown period.
Same Day Start:
- Maximum throughput (~47 passes/year with 5 accounts)
- 42% chance ALL accounts fail together
- “Feast or famine” pattern
7-Day Stagger:
- 67% of max throughput (~31 passes/year)
- Only 22% all-fail risk
- Smoother, more consistent income
What’s Included
- Phoenix Strategy Files
Compiled NinjaTrader 8 files for NQ/MNQ and ES/MES - Recommended Settings
Optimized parameters for M5 chart on all four instruments - Setup Guide
Step-by-step NinjaTrader configuration walkthrough - Full Robustness Reports
All test results and analysis documents - Phoenix Trade Alerts (separate service for options traders)
Slack alerts for options traders using NQ signals — $149/mo
Requirements
- NinjaTrader 8
Active license required (Lifetime or Lease) - NQ or ES Data Feed
Real-time futures data for your chosen instrument(s) - Futures Trading Account
Broker account approved for NQ/ES futures or prop firm evaluation - Recommended Capital
Minimum $10,000 or prop firm evaluation account
Stop Guessing. Start Trading With a Validated Edge.
Phoenix is built for traders who are done gambling with evaluations and ready to trade with a disciplined, repeatable system on NQ, MNQ, ES, or MES. No hype. No shortcuts. Just a proven process.
Risk Disclosure
FUTURES TRADING CONTAINS SUBSTANTIAL RISK AND IS NOT SUITABLE FOR EVERY INVESTOR. AN INVESTOR COULD POTENTIALLY LOSE ALL OR MORE THAN THEIR INITIAL INVESTMENT.
Educational content only. Any market recommendations or trade examples are generic and for educational purposes. You enter into any transactions relying solely on your own judgment.
Past performance is not necessarily indicative of future results. View Full Risk Disclosure
Our Recommended Trading Platform

NinjaTrader® is our #1 recommended trading software platform preferred by traders worldwide including our clients.
Download NinjaTrader & receive immediate FREE access to:
- Real-time futures data
- Advanced charting
- Trade simulator
- Strategy development and backtesting
NinjaTrader's award-winning trading platform is consistently voted an industry leader by the trading community. Featuring 1000s of Apps & Add-Ons for unlimited customization, NinjaTrader is used by over 1.9 million traders for advanced market analysis, professional charting and fast order execution.
For new traders, start preparing for the live markets with a free trading simulator featuring real-time market data.
Our Recommended Market Data Feed

Kinetick® delivers reliable, fast and cost-effective market data to help level the playing field for active traders. Take advantage of unfiltered, real-time quotes for stocks, futures and forex that exceed the expectation of the world's most demanding traders, like us!
Get started with FREE end-of-day historical market data directly through the NinjaTrader platform and learn how you can significantly reduce CME Group Globex exchange fees on real-time market data with Kinetick