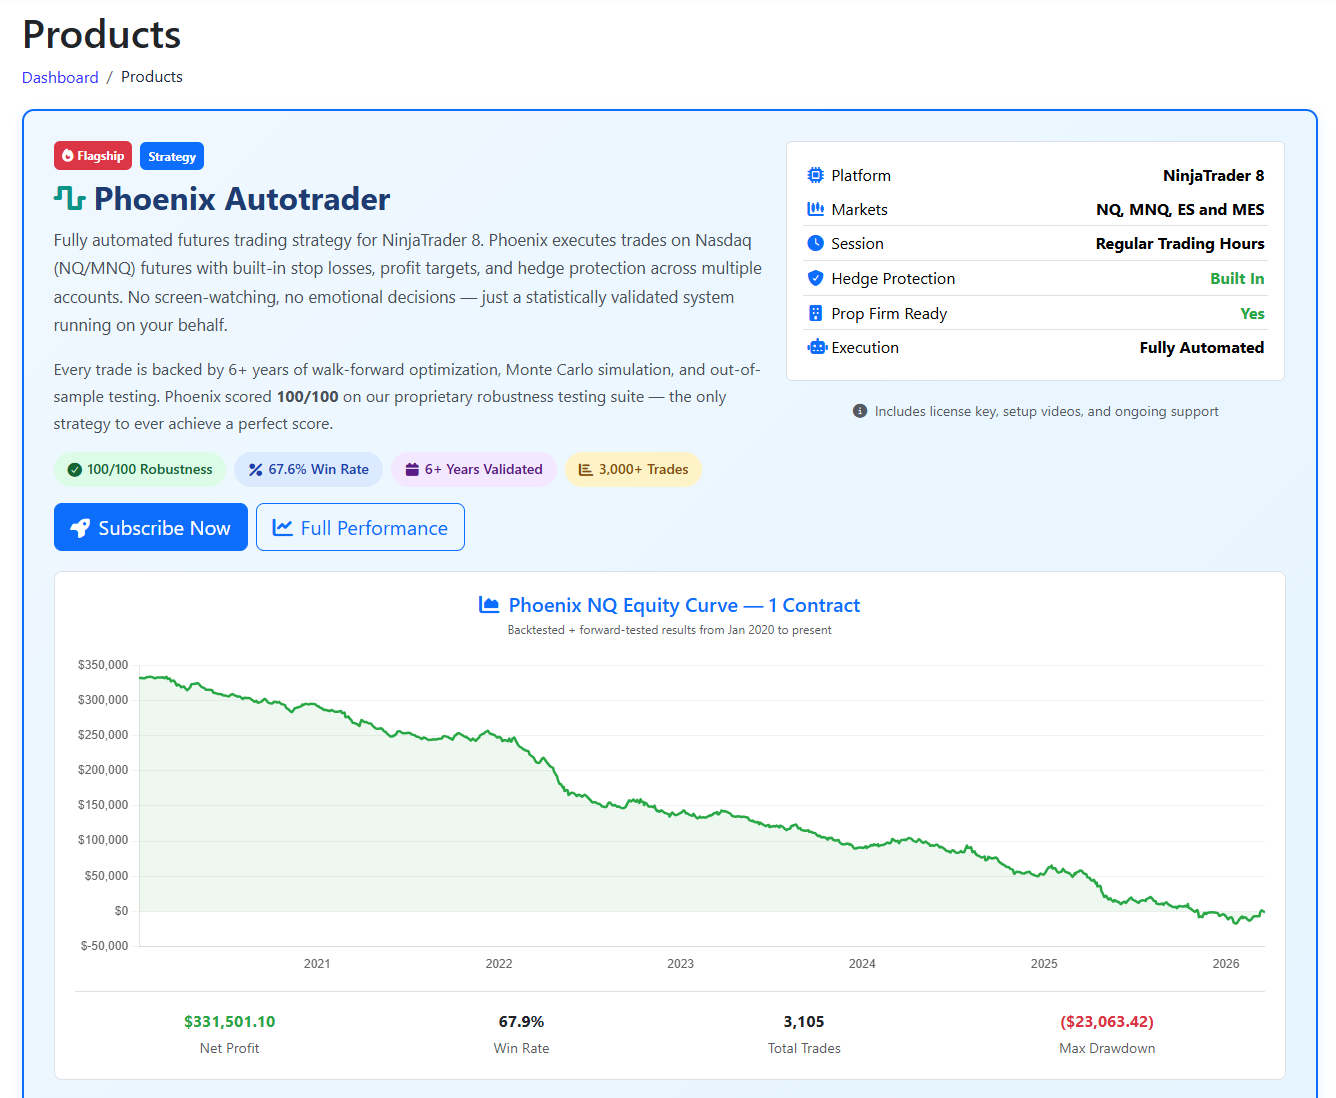
Phoenix equity curve on Product Page looks backwards

Started by Jeffrey Williams on Mar 26, 2026 at 1:49 PM
507 views � 1 replies
Posted Mar 26, 2026 at 1:49 PM Edited
https://futures.aeromir.com/products
The Phoenix equity curve looks like it is being graphed backwards - it starts at $331k and falls to $0 - probably not what you intended to show. It is graphed correctly on other pages - https://futures.aeromir.com/performance

Posted Mar 27, 2026 at 3:10 AM
interesting. That's an odd thing.  Thanks for letting me know. I suspect I sorted the trades and then saved them... I'll fix it!

Want to join the discussion?

Login or create an account to reply to this thread.