
Data Exporter for NinjaTrader 8
Build multi-timeframe datasets in minutes, not hours. Export your chart data — including indicator values — to CSV with one click for backtesting, Excel analysis, or building custom models in Python/R.
How It Works
One-click on-chart export (no menu drilling). Clean OHLCV in seconds.
1) Import
Import the .zip in NinjaTrader (Tools > Import > NinjaScript Add-On).
2) Add to a Chart
Add Data Exporter as a strategy to any chart (any instrument / any bar type).
3) Click Export
Wait for the Export button to turn blue, click it, pick your columns, and the CSV is generated instantly.
Four Features That Set It Apart
Export indicator values alongside your bars with headers that stick, strip out FOMC and holiday noise, get VWAP with standard deviation bands calculated automatically, and time your bars down to the millisecond.
Export Chart Indicators with Custom Column Names
When you click Export, one dialog opens listing every VWAP column and every indicator plot on your chart, in clearly labeled sections. Check what you want, rename each column header to something meaningful — "vwap", "upper_band", "atr14" — and they land in the CSV exactly as labeled. No post-processing, no copy-pasting values out of NinjaTrader.
And you only type those names once. Data Exporter keeps a permanent registry of every column you have ever named. Open a different chart six months later, and the same indicator comes back pre-checked with your header already in the box. The registry survives quarterly contract rolls too, so Order Flow Cumulative Delta headers no longer orphan themselves every March, June, September, and December.
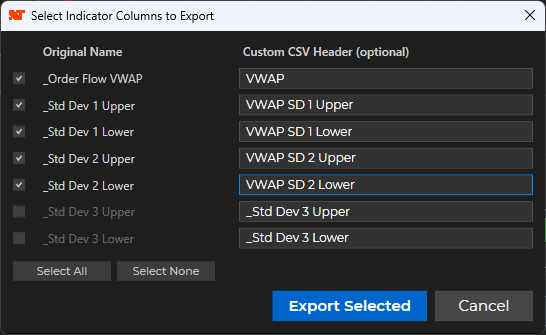
delta_close and the export writes
Order Flow Cumulative Delta(ES 12-26 (1 Minute);Bid Ask;Session;0)_Delta Close,
the load breaks. Naming a column once and having it hold means your CSV schema stays stable
across charts, across contracts, and across months — which is the whole point of an automated pipeline.
FOMC & Holiday Date Filtering
FOMC announcement days and US federal holidays are outlier sessions — abnormal volatility, wide spreads, and behavior that doesn't represent typical market conditions. Including them in a backtest can skew results and mask a strategy's true edge.
Data Exporter automatically strips those bars before writing the file. Choose to exclude FOMC days only, holidays only, or both — no date lists to maintain, no manual filtering in Excel after the fact. The active filter is baked right into the filename so your dataset library stays organized.
Native VWAP Export — No Indicator Required
Most VWAP exports require you to add a VWAP indicator to your chart first. Data Exporter calculates session VWAP natively during export — no OrderFlowVWAP or any other indicator needed. Enable it with one checkbox and get 12 ready-to-use columns appended to every row, including PriorVWAP for mean-reversion strategy research.
All 12 columns export automatically when VWAP is the only thing you have enabled. Turn on chart indicator
export as well and the column selector opens, with the VWAP columns in their own section — uncheck the
ones you don’t need for leaner Builder files, or hit Select None and check just VWAP
and PriorVWAP for a minimal mean-reversion dataset. Renamed VWAP columns keep their values, so
DistVWAP_Z can become dist_vwap_z without exporting blanks.
Works on any bar type including range bars and tick bars. Session resets automatically at the session open.
Millisecond Bar Timing
On price-based bars — Renko, range, volume, tick — how fast a bar formed is often more informative than the bar itself. A range bar that closed in 180 milliseconds is a burst of momentum. The same bar taking 40 seconds is consolidation. Data Exporter records that elapsed time as an optional MsSincePrior column.
Selecting the bar-timing option also switches timestamps to millisecond precision, so two bars closing inside the same second no longer share a datetime key — which matters the moment you load a file into a database and try to index on it.
Real Exported Files
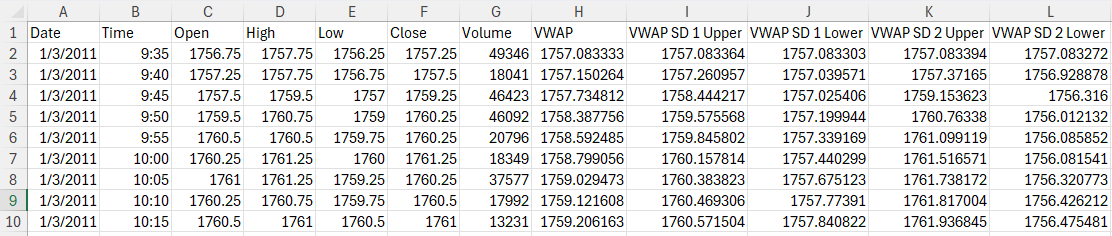
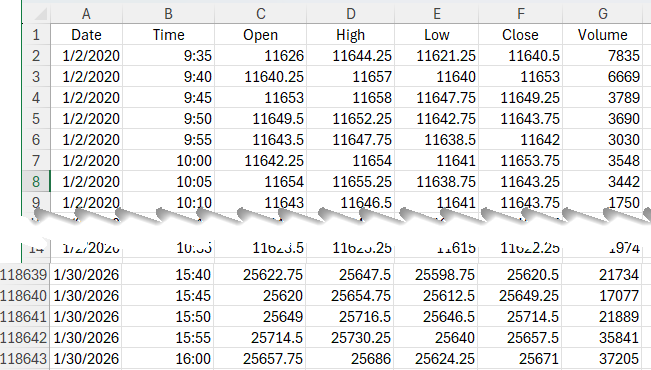
See exactly what you get: clean OHLCV CSV output, indicator columns, and automatic file naming.
Clean CSV Output — With Indicator Columns
Smart Filenames (Perfect for Datasets)

Millisecond Bar Timing
Optional "MsSincePrior" column for range, volume, and Renko bar users — millisecond resolution, so bars closing inside the same second stay distinguishable. Detect fast momentum vs slow consolidation in Build Alpha or StrategyQuant.
Want to inspect the CSV format first? Download sample exports:
Works with your research stack
Export any bar type
Data Exporter saves time
Built for research workflows
Powerful Features, Simple Interface
Everything you need to export your NinjaTrader data efficiently
One-Click Export
Click the Export button on your chart. No complicated menus or settings to navigate.
Clean CSV Output
Exports Date, Time, Open, High, Low, Close, and Volume — ready for Excel, Sheets, Python, R, and more.
Flexible Formats
Choose US or ISO date format, include or exclude headers, pick your timestamp precision from minutes down to milliseconds, or drop the time column entirely for daily bar exports.
Auto Backup
The save dialog warns before overwriting an existing file. Or skip the prompt entirely by enabling automatic backups or timestamped filenames.
Any Bar Type
Export whatever's on your chart — second, minute, hour, daily, weekly, monthly, tick, volume, range, or renko bars. If NinjaTrader can display it, Data Exporter can export it.
Smart Filenames
Auto-generates descriptive filenames including symbol, timeframe, session type, date range, date format, active date filter, and time window.
Export Chart Indicators
Select exactly which indicator plots to include as additional CSV columns. Rename each column header to anything you want — export VWAP bands, moving averages, ATR, cumulative delta, or any indicator directly alongside OHLCV data.
Column Names Remembered
Rename a column once — "delta_close", "atr14", "vwap_z" — and Data Exporter recalls it on every future export that includes that indicator, on any chart. Selections persist too, so a repeat export is two clicks. Headers survive quarterly contract rolls, including Order Flow Cumulative Delta.
No Partial Exports
The Export button stays greyed out until your chart has finished loading every historical bar. On heavy multi-year charts you can't accidentally click too early and walk away with a truncated dataset — the button tells you the truth about what's loaded.
FOMC & Holiday Filtering
Automatically exclude FOMC announcement days and/or US federal holidays from your export. Keep backtesting datasets clean without manual date scrubbing — filter options are reflected right in the filename.
Millisecond Bar Timing
Optional MsSincePrior column records elapsed time between bar closes in milliseconds, not whole seconds — essential on Renko and range bars where several bars can close inside a single second. Timestamps go to HH:mm:ss.fff so every bar keeps a unique datetime key.
Time-of-Day Filter
Export only the bars within your trading window. Switch on the time filter and set a start and end time, or leave both at 12:00 AM and Data Exporter auto-detects the session range from your chart data. Perfect for isolating RTH bars from an ETH dataset without loading a separate chart.
Native VWAP Export
No indicator needed on your chart. Enable one checkbox for 12 ready-to-use VWAP columns — session VWAP, three standard deviation bands (upper & lower), DistVWAP, rolling standard deviation, Z-score, and PriorVWAP (prior session’s final VWAP). Pick a subset from the column selector when you want leaner files. Works on any bar type. Resets at each session open.
Update Notifications
Data Exporter tells you when a new version is available, so you're not running last year's build without knowing it. Updates are free for life — and you can switch the notification off if you'd rather not be interrupted.
Built for Serious Traders
How traders use Data Exporter in their workflow
Strategy Development
Export historical data to test ideas in Excel, Python, StrategyQuant X, Adaptrade Builder, or Build Alpha before coding them in NinjaScript.
Indicator Research
Export VWAP, moving averages, Bollinger Bands, cumulative delta, or any chart indicator directly alongside OHLCV data. Pick exactly which plots you want and give each column a meaningful name — no post-processing needed.
Machine Learning
Feed clean OHLCV and indicator data into ML pipelines for pattern research and model development.
Momentum Detection
Use the optional MsSincePrior column with range, volume, or Renko bars to separate fast-moving momentum from slow consolidation in Build Alpha or StrategyQuant X — at millisecond resolution, so sub-second bursts aren't rounded away to zero.
Clean Backtesting Datasets
Use the built-in FOMC and holiday filter to strip high-noise days before export. Your backtesting tool gets a clean dataset without any manual date management on your end.
Session Isolation
Trading only the morning session? Turn on the time filter and set a start and end time to export just those bars. Or leave both at 12:00 AM and Data Exporter auto-detects the range from your chart — useful when you want a clean RTH subset from an ETH chart without switching data series.
Repeatable Data Pipelines
Name your columns once and every future export writes the same schema — across charts, across instruments, and across quarterly contract rolls. Your loader scripts keep working instead of breaking every time a contract turns over.
Trade Journaling
Export session data to review and document your trading day alongside your trade log.
Data Sharing
Share market data with colleagues, mentors, or students in a universal CSV format.
Database Building
Build your own historical database by exporting and archiving data from different sessions.
Simple, One-Time Pricing
Pay once, use forever. No subscriptions, no recurring fees.
Data Exporter
- Lifetime license
- Free updates
- Use on 2 computers
- All bar types supported
- Export chart indicators with custom column names
- Custom column names remembered across every export
- FOMC & holiday date filtering
- Time-of-day filtering
- Millisecond bar timing & timestamps
- Native VWAP export — 12 columns including PriorVWAP, no indicator required
- VWAP column selector — export only what you need
- Support via Phone or Support Ticket
- Instant download
Secure checkout via Stripe
Frequently Asked Questions
What version of NinjaTrader is supported?
Data Exporter works with NinjaTrader 8. It is not compatible with NinjaTrader 7.
How do I install it?
After purchase, you will receive a download link. Import the .zip file using NinjaTrader's Tools > Import > NinjaScript Add-On menu. Then add Data Exporter as a strategy to any chart.
Can I export indicator values alongside OHLCV?
Yes. When you click Export, a dialog lists every indicator plot currently on your chart, grouped in labeled sections alongside the VWAP columns. Check the ones you want, optionally rename each column header to something meaningful (like "vwap" or "upper_band"), and they'll be included as additional columns in the CSV. Any indicator already on your chart works — VWAP, moving averages, Bollinger Bands, ATR, Order Flow Cumulative Delta, and more. Select All and Select None buttons are there for when you're switching between wide and narrow datasets.
Do I have to rename my columns every time I export?
No. Data Exporter keeps a permanent registry of every column you have ever named, stored with your NinjaTrader user data. Type "delta_close" once and it comes back pre-filled on every future export that includes that indicator — on any chart, months later. Your checked/unchecked selections persist the same way.
The registry is also contract-aware. Indicators like Order Flow Cumulative Delta embed the contract month in their internal name, which used to orphan saved headers at every quarterly roll. Data Exporter strips the contract out of the lookup key, so your headers survive the roll. Existing saved delta headers need re-confirming once after updating, then they hold permanently.
What does FOMC and holiday filtering do?
Data Exporter can automatically exclude bars that fall on FOMC announcement days and/or US federal holidays before writing the CSV. You can filter FOMC only, holidays only, or both. This is especially useful when building backtesting datasets where you want to remove high-noise, anomalous days without manually managing a date list. The active filter is included in the filename so your datasets stay organized.
Why is the Export button grey?
The button stays grey and reads LOADING until your chart has finished pumping in every historical bar. Clicking early would export an incomplete dataset, so Data Exporter simply doesn't let you. It turns blue when the load is genuinely done, and drops back to grey if you reload the chart. On a heavy multi-year chart with order flow indicators, give those indicator panels a moment to finish calculating before exporting delta columns.
How much historical data can I export?
Data Exporter exports whatever data is loaded on your chart. The amount of history available depends on your data provider and bar type:
- Daily bars: 20+ years typically available
- Minute bars: 5-10 years depending on provider
- Range, Volume, Tick, Renko bars: Built from tick data - history varies by provider:
- Kinetick: ~6 months
- IQFeed: 180+ days (often more)
- eSignal: Extended history available
- Rithmic (Apex, Bulenox, etc.): Data back to 2011, but 40GB weekly download limit — heavy tick/range bar loading can hit this cap. Resets each Sunday.
Tip: If you need longer history for range/volume bars, consider a provider like IQFeed, or record tick data locally in NinjaTrader over time.
If I purchase historical tick data, how do I import it into NinjaTrader?
NinjaTrader 8 can import historical data files via Tools > Import > Historical Data. Most tick data vendors (like TickData.com or FirstRateData.com) provide files in NinjaTrader-compatible formats or include conversion instructions.
Once imported, the tick data is stored locally in your NinjaTrader database. You can then load a range, volume, or renko chart and NinjaTrader will build the bars from your imported tick history — giving you years of data instead of months.
See NinjaTrader's Import Historical Data documentation for file format details.
Can I use it on multiple computers?
Yes, your license allows installation on up to 2 computers.
What data formats are supported?
Data Exporter outputs standard CSV files with Date, Time, Open, High, Low, Close, and Volume columns, plus any VWAP or indicator columns you select. You can choose between US (MM/DD/YYYY) and ISO (YYYY-MM-DD) date formats, set timestamp precision to minutes, seconds, or milliseconds, or drop the Time column altogether for daily bar exports where it isn't meaningful.
Does it work with all instruments?
Yes, Data Exporter works with any instrument that NinjaTrader supports — futures, stocks, forex, crypto, and more.
Do I need a data feed subscription?
Data Exporter exports whatever data is already loaded on your chart. You need an active data connection to load bars, but the export itself works with any data provider.
What is the "MsSincePrior" column?
When exporting range, volume, tick, or Renko bars, this optional column records how many milliseconds elapsed since the previous bar closed. Fast bars (a few hundred ms) indicate strong momentum; slow bars (tens of seconds) indicate consolidation. Selecting this option also writes bar timestamps as HH:mm:ss.fff, so two bars closing inside the same second no longer share a datetime key — which matters when you're loading exports into a database.
Note: earlier versions wrote whole seconds under the header "SecondsSincePrior." Current builds write milliseconds under "MsSincePrior" — the rename is deliberate, so an ingest script can tell which format it's reading. Sub-second resolution depends on your data feed; if the feed timestamps only to the second, values will land on 1000 ms multiples.
What is the native VWAP export?
Enable “Export VWAP columns” in the strategy properties and Data Exporter calculates session VWAP itself — no indicator on the chart required. Twelve columns are appended to every row:
- VWAP — session VWAP price (resets at each session open)
- SD1/SD2/SD3 Upper & Lower — standard deviation bands
- DistVWAP — close minus session VWAP in points
- VWAP_SD — 20-bar rolling standard deviation of DistVWAP
- DistVWAP_Z — DistVWAP divided by VWAP_SD (Z-score)
- AbsDistVWAP_Z — absolute value of the Z-score
- PriorVWAP — previous session’s final VWAP, held constant across all bars of the current session. Ideal for mean-reversion strategies that compare today’s running VWAP against yesterday’s volume-weighted fair value.
With VWAP enabled on its own, all 12 columns export automatically. Turn on chart indicator export as well and the column selector opens with the VWAP columns in their own section, so you can trim the list. Renamed VWAP columns still populate correctly. Works on any bar type including range bars and tick bars.
Note: VWAP is calculated on the full chart before the time-of-day filter is applied. If you export an RTH window from an ETH chart, the VWAP columns will include overnight volume.
Ready to Simplify Your Data Workflow?
Get Data Exporter today and start exporting in minutes.
Buy Now - $99