

Aeromir Trade Alerts
Real-time futures and options signals delivered to Slack Phoenix has 5–25 minutes of advance notice before each entry. Tachyon has a 5-minute window. Covers signal interpretation, SPX 0DTE spread selection with the Phoenix and Tachyon spreadsheet, and your daily pre-market routine.
Course Contents
Welcome to Phoenix Trade Alerts
Real-time NQ and ES futures signals delivered to Slack — with 5 to 25 minutes of advance notice before each entry fires.
What Phoenix Trade Alerts Is
Phoenix is a mean-reversion futures strategy that has traded live on NQ and ES for six years with a 67.8% NQ win rate across 3,121 trades. Subscribers don't get a chatroom guru's opinion or a hand-drawn chart pattern. They get a statistically validated, robustness-tested directional signal — delivered to their phone via Slack before each trade fires.
A subscription includes:
- Real-time NQ signals via #alerts-phoenix-nq-trades
- Real-time ES signals via #alerts-phoenix-es-trades
- Setup Forming alerts — 5 to 25 minutes advance notice
- Entry alerts with direction, price, target, and stop
- Exit alerts with result and options guidance
- ~42 NQ signals/month + ~34 ES signals/month
- Phoenix Spread Selector — Excel/VBA spreadsheet with live ThinkorSwim RTD integration for options traders
- Options Strategy Guide at aeromir.com/osg
- Weekly Zoom support meetings — Thursdays 1 PM ET
- Slack support channel — #support
- Forums at futures.aeromir.com/forums
The Numbers Behind the Signal
Phoenix has been backtested and validated across six years of live market data — every major regime including the 2020 COVID crash, 2022 bear market, and 2024 AI rally.
Profitable every year from 2020 through 2025. FOMC days and market holidays are automatically filtered — no signals on the days when the edge doesn't apply.
Where to Go From Here
This course is organized around how you plan to trade the signals. Follow the path that matches your situation.
This is the primary audience for Phoenix signals. You'll use the direction signal to sell 0DTE SPX vertical credit spreads.
Start with:
Module 1 → Module 2 → Module 3 → Module 5
You'll execute Phoenix signals as NQ, MNQ, ES, or MES futures trades in your own platform.
Start with:
Module 1 → Module 2 → Module 4
Some subscribers trade futures on one account and use the signals for options on another. Read everything.
Start with:
Module 1 → Module 2 → Module 3 → Module 4 → Module 5
Before Your First Signal Fires
Two things need to be done before you're ready to trade:
- Slack is set up and notifications are working on your phone. If your phone doesn't buzz when a signal posts, you'll miss the window to act. This is covered in Lesson 2.
- You know what to do when the entry alert fires. The execution workflow needs to be automatic under time pressure. Modules 3 and 4 cover this in detail for options and futures traders respectively.
Support & Community
Questions before, during, or after a trade:
| Channel | Best For | Where |
|---|---|---|
| Slack #support | Quick questions, community answers, Tom monitors regularly | Inside the Aeromir Slack workspace |
| Slack #phoenix-nq-general-discussion | Trade discussion, subscriber questions, sharing results | Inside the Aeromir Slack workspace |
| Support ticket | License issues, billing, technical problems requiring a back-and-forth | futures.aeromir.com/support-ticket |
| Weekly Zoom | Live Q&A, screen share, hear what other subscribers are working through | Thursdays 1 PM ET — futures.aeromir.com/schedule |
| Forums | Longer discussions, strategy questions, archived answers | futures.aeromir.com/forums |
Slack Setup & Notifications
How to join the Phoenix workspace, find your channels, and configure notifications so you never miss a signal.
Why Phoenix Uses Slack
Phoenix signals are delivered through Slack because it's the most reliable way to get an alert to your phone, desktop, and browser simultaneously — with sub-second delivery and no email spam filters in the way. When a signal fires, you have a narrow window to execute. Slack's push notifications are the fastest path from the signal machine to your hands.
You'll be added to private signal channels — one for NQ signals and one for ES signals. Both channels are read-only for subscribers. Tom and the signal machine are the only ones posting there.
Step 1 — Join the Workspace
After your subscription is confirmed, you'll receive an email invitation to the Aeromir Phoenix Slack workspace.
Check your email for the Slack invite. The subject will be from Slack: "Tom Nunamaker has invited you to join..."
Click the invite link. If you already have a Slack account, log in. If not, create a free account — it takes 2 minutes.
Download the Slack app on your phone if you haven't already. Available on iOS and Android. This is not optional — browser-only Slack does not deliver reliable push notifications.
Sign into the Aeromir workspace on your phone app. You should see the Phoenix channels in your sidebar.
If you don't receive an invite within 24 hours of subscribing, open a support ticket at https://futures.aeromir.com/support-ticket. Access is added manually after subscription review.
Step 2 — Find Your Channels
You'll have access to four Phoenix channels. Here's what each one is for:
| Channel | Purpose | Who Posts |
|---|---|---|
| #alerts-phoenix-nq-trades | All NQ signals — Setup Forming, Entry, and Exit alerts | Signal machine only — read-only for subscribers |
| #alerts-phoenix-es-trades | All ES signals — Setup Forming, Entry, and Exit alerts | Signal machine only — read-only for subscribers |
| #alerts-phoenix-nq-general-discussion | Questions, trade sharing, community discussion for NQ traders | All subscribers + Tom |
| #alerts-phoenix-es-general-discussion | Questions, trade sharing, community discussion for ES traders | All subscribers + Tom |
Follow #alerts-phoenix-nq-trades for signals.
Options traders using NQ direction for SPX spreads should follow this channel. Join #alerts-phoenix-nq-general-discussion for community discussion.
Follow #alerts-phoenix-es-trades for signals.
Options traders who prefer ES correlation for SPX spreads should follow this channel. Join #alerts-phoenix-es-general-discussion for community discussion.
Step 3 — Configure Notifications
This is the most important setup step. Default Slack notification settings are often too conservative — you need to override them specifically for the Phoenix signal channels.
On Your Phone (iOS or Android)
Open Slack and go to #alerts-phoenix-nq-trades (and #alerts-phoenix-es-trades if you follow both).
Tap the channel name at the top to open channel details.
Tap Notifications.
Set to "Every new message" — not "Default" or "Mentions only." Every post in this channel is a signal. You want all of them.
Go to your phone's Settings → Notifications → Slack and confirm alerts are on with sound enabled.
Do Not Disturb Hours
If you have Slack's Do Not Disturb schedule enabled, make sure it doesn't cover market hours (9:30 AM – 4:00 PM ET). Phoenix signals only fire during RTH — but if your DND window overlaps with the morning session, you'll miss alerts silently.
In Slack: tap your profile picture → Pause notifications — make sure this is off during market hours.
On Your Desktop
Desktop notifications are a useful backup but not a substitute for mobile. In Slack desktop: Preferences → Notifications → set the Phoenix signal channels to "All new messages." Also make sure your computer's focus or do-not-disturb mode isn't blocking Slack during market hours.
Slack Do's and Don'ts
- Set signal channel notifications to "Every new message"
- Install the Slack app on your phone
- Test that your phone buzzes when a message arrives
- Check channel history if you missed an alert — all three messages are always there
- Mute the channel on weekends — no signals fire outside RTH or on holidays
- Email support if you stop receiving alerts unexpectedly
- Rely on checking Slack manually without push notifications
- Use browser-only Slack as your primary alert method
- Post questions or comments in the signal channels — they're read-only
- Trade a Setup Forming alert as if it's an entry — direction isn't confirmed yet
- Assume something is broken just because the channel is quiet — check the calendar first
- Panic if you miss an alert — scroll up, read all three messages, decide if you're still in the entry window
FOMC Days and Market Holidays
On FOMC meeting days and US market holidays, Phoenix will not post any signals. No Setup Forming, no Entry, no Exit. The channels will be silent. This is intentional — the FOMC and holiday filter is built into the strategy.
If you open Slack during market hours and see nothing in the channel, check the Aeromir Economic Calendar before assuming something is wrong. FOMC dates are listed months in advance.
Your First Signal — What to Expect
A walkthrough of exactly what happens from the moment a Setup Forming alert fires to the moment the trade closes — so your first live signal isn't a surprise.
The Timeline of a Phoenix Trade
Every Phoenix trade follows the same sequence. Understanding this sequence before your first signal fires means you'll know exactly what to do at each step — and what not to do.
-
5–25 minutes before entry — Setup Forming alert firesPhoenix detects conditions building for a directional move. Your phone buzzes. No trade has fired yet. Direction is shown along with the probability of triggering and how long the alert is valid. Options traders: start preparing your spread on the indicated side. -
Sometimes the Entry Alert fires without a Setup Forming alert. When market conditions develop and confirm quickly, Phoenix may post the Entry alert with little or no gap after the Setup Forming — or in fast-moving conditions, the Setup Forming may not appear in Slack before the Entry alert arrives. Don't wait for a Setup Forming alert before watching your channels.
IMPORTANT: If an Entry alert appears, act on it regardless of whether you saw a Setup Forming first.
Entry alert fires — direction is confirmedThe trade is on. You see direction, entry price, profit target, stop loss, and a 30-minute close-by time. This is when you act. For futures traders: enter the position. For options traders: sell the appropriate spread and place your closing orders immediately. -
Trade runs — you walk awayWith your stop, target, and time stop in place, there's nothing left to do. Watching the trade and second-guessing it is the fastest way to override the edge. Let your orders manage it. -
30-minute close-by time — check your positionIf the profit target hasn't filled by the close-by time shown in the entry alert, close your position at market. For options traders using ThinkorSwim time stops, this fires automatically. For everyone else — check and close manually if needed. -
Exit alert fires — trade is closedPhoenix posts the result — profit target, stop loss, breakeven, or time stop — with options guidance. Verify your position is flat. Done.
What a Real Signal Looks Like
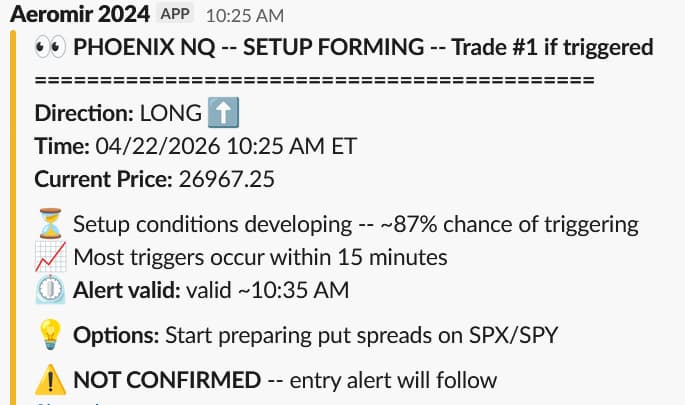
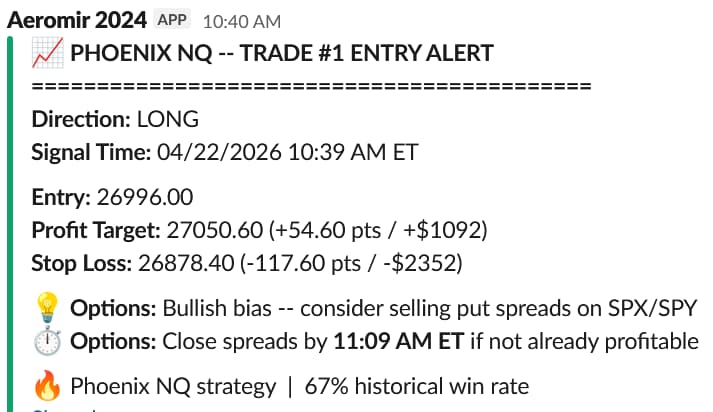
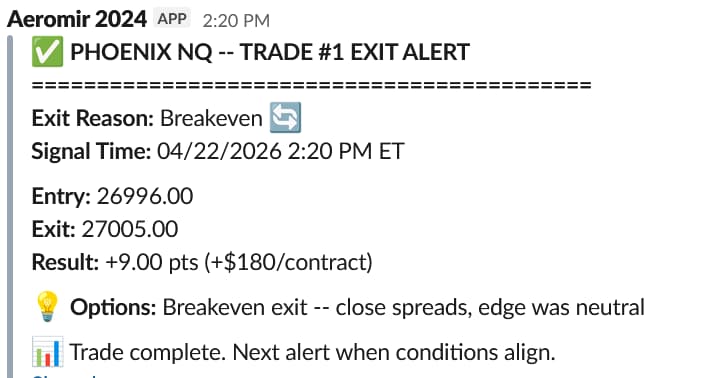
Here's an actual Phoenix NQ signal sequence from April 22, 2026. This is exactly what you'll see in Slack.
Alert 1 — Setup Forming
Your advance notice. Direction is shown along with the probability of triggering and how long the setup is valid. Options traders: start preparing the indicated spread — but don't enter yet.
Alert 2 — Entry Alert
The trade is confirmed. Entry price, profit target, stop loss, the 30-minute close-by time, and specific options guidance are all here. Act immediately.
Alert 3 — Exit Alert
The trade is closed. This tells you the result and what to do with your options position.
What Can Also Happen — Setup Canceled
Sometimes a Setup Forming alert fires but conditions change before the entry develops. You'll see a Setup Canceled message in the channel. No trade was taken — nothing to do.
Exit Reasons You'll See
| Exit Reason | What It Means | Options Trader Action |
|---|---|---|
| Profit Target | The futures trade hit its profit target. A winner. | Your GTC limit order likely already filled. Verify position is flat. |
| Stop Loss | The futures trade hit its stop. A loser in futures — but 80.8% of these were still profitable on the spread at 30 minutes. | Your time stop should have closed the spread at or before 30 minutes. Verify position is flat. |
| Time Stop | The trade reached its 30-minute cap without hitting target or stop. Closes flat or near flat in futures. | Your ThinkorSwim time stop fired automatically. Verify position is flat. |
| Breakeven | The MFE breakeven mechanism triggered after the trade moved favorably then reversed to near entry. | Close spreads at market — options guidance in the exit alert will say "edge was neutral." Small profit or flat depending on theta decay. |
The Most Common First-Trade Mistakes
What to Read Next
Module 2 covers every alert type in detail — every field, what it means, and exactly what to do with it. After that, go directly to the guide for how you plan to trade:
- Module 3 — Options Trader Guide — if you're selling SPX credit spreads
- Module 4 — Futures Trader Guide — if you're trading NQ, MNQ, ES, or MES directly
- Module 5 — The Phoenix Spread Selector — the Excel spreadsheet that automates spread selection and order entry for options traders
The Three Alert Types
Every Phoenix trade produces exactly three Slack messages. This lesson gives you the overview — Lessons 2, 3, and 4 cover each one in detail.
The Alert Sequence
Phoenix signals always follow the same structure. Three messages, in order, every time. Understanding what each one means — and what it asks you to do — is the foundation of trading Phoenix signals correctly.
Setup Forming
Advance notice. No trade yet. Get ready.
Entry Alert
Trade confirmed. Act now.
Exit Alert
Trade closed. Verify you're flat.
Alert 1 — Setup Forming
The Setup Forming alert is your advance notice. Phoenix has detected conditions building for a directional trade but has not entered yet. This is your window to get ready.
| Field | What It Means | Your Action |
|---|---|---|
| Direction | The anticipated direction of the trade — LONG or SHORT. This is the signal's best assessment at this stage but is not yet confirmed. | Start preparing the appropriate spread side. LONG = put spreads. SHORT = call spreads. |
| Current Price | The NQ price at the time the setup was detected. | Reference only — use the entry price from the Entry alert for your actual trade. |
| Probability | Phoenix's estimated probability that this setup will trigger an entry — e.g. ~87% chance of triggering. | Higher probability = higher urgency to get ready. Even high-probability setups can cancel. |
| Alert Valid | The approximate time window the setup is valid — e.g. valid ~10:35 AM. After this time, the setup expires if no entry has fired. | If the Entry alert hasn't fired by this time, stand down — the setup likely expired. |
| Options guidance | Specific instruction for options traders — e.g. "Start preparing put spreads on SPX/SPY." | Open your options chain and have the appropriate spread side ready to structure quickly. |
Alert 2 — Entry Alert
The Entry alert is the trade. When this fires, act immediately. Every field in this alert has a specific purpose — Lesson 3 covers each one in detail.
| Field | What It Means | Your Action |
|---|---|---|
| Direction | LONG or SHORT — confirmed. This is the trade direction. | LONG = sell put spread or buy futures. SHORT = sell call spread or sell futures. |
| Signal Time | The exact time Phoenix entered on the signal machine. | Reference — compare to current time to assess how late you are to the entry. |
| Entry | The NQ price at which Phoenix entered. | Enter at market or near this price. If price has moved more than 10–15 points, consider skipping. |
| Profit Target | Phoenix's profit target in NQ points and dollars per MNQ contract. | Futures traders: set a limit order at this price. Options traders: your GTC limit handles the spread exit. |
| Stop Loss | Phoenix's stop loss in NQ points and dollars per MNQ contract. | Futures traders: set a stop order at this price immediately after entry. |
| Close Spreads By | The 30-minute close-by time for options traders — exactly 30 minutes after the signal time. | Options traders: set your ThinkorSwim time stop for this exact time immediately after fill. |
| Options guidance | Specific instruction — e.g. "Bullish bias — consider selling put spreads on SPX/SPY." | Confirms which spread type to use. Follow this if you haven't already acted on the Setup Forming guidance. |
Alert 3 — Exit Alert
The Exit alert tells you the trade is closed and why. When you see this, verify your position is flat. If you still have an open position, close it at market immediately.
| Field | What It Means | Your Action |
|---|---|---|
| Exit Reason | Why the trade closed — Profit Target, Stop Loss, Breakeven, or Time Stop. | See exit reason guide below. |
| Signal Time | The time the exit fired on the signal machine. | Reference only. |
| Entry / Exit | The NQ entry and exit prices. | Compare to your own fill prices to assess execution quality. |
| Result | Points gained or lost and dollar value per MNQ contract. | Reference for your own trade journal. |
| Options guidance | Specific instruction for options traders — e.g. "close spreads, edge was neutral." | If your spread is still open, follow this guidance to close or take action. |
Exit Reasons at a Glance
| Exit Reason | Futures Result | Options Trader Action |
|---|---|---|
| Profit Target | Winner — profit target hit. | GTC limit likely already filled. Verify flat. |
| Stop Loss | Loser — stop triggered. 80.8% of these were still profitable on the spread at 30 minutes. | Time stop should have fired. Verify flat. Close manually if still open. |
| Breakeven | MFE breakeven stop triggered after a favorable move then reversal. Small gain near entry. | Close spreads at market. Options guidance will say "edge was neutral." |
| Time Stop | 30-minute cap reached. Closes flat or near flat. | ThinkorSwim time stop fired automatically. Verify flat. |
The Fourth Message — Setup Canceled
Occasionally you'll see a Setup Canceled message after a Setup Forming alert. This means conditions changed before an entry developed. No trade was taken — nothing to do.
Setup Forming — What It Means
The Setup Forming alert is your advance notice. Here's everything in it, what it's telling you, and exactly how to use the 5–25 minute window before the entry fires.
What's Happening When This Alert Fires
Phoenix monitors NQ and ES on 5-minute bars during Regular Trading Hours. When the strategy detects that entry conditions are developing — but haven't fully confirmed yet — it posts the Setup Forming alert. Think of it as Phoenix raising its hand and saying "something is building here, get ready."
At this point:
- No position has been opened on the signal machine
- No order has been placed anywhere
- The setup may confirm into a full entry — or it may cancel
- The direction shown is Phoenix's best assessment at this stage
The Alert — Every Field Explained
| Field | What It Means | Notes |
|---|---|---|
| Trade # | Sequential trade number for the session — e.g. Trade #1. Matches across the Setup Forming, Entry, and Exit alerts for the same trade. | Useful for matching alerts when multiple setups fire in the same session. |
| Direction | LONG ?? or SHORT ?? — the anticipated direction of the trade. | LONG = bullish setup developing. SHORT = bearish setup developing. Use this to start preparing the appropriate spread side. |
| Time | The exact time the setup was detected on the signal machine, in Eastern Time. | Reference. Compare to current time to assess how fresh the alert is. |
| Current Price | The NQ price at the moment the setup was detected. | Reference only. Use the Entry alert price for your actual trade — not this number. |
| ~% chance of triggering | Phoenix's estimated probability that this setup will confirm into a full entry based on historical patterns. | Higher probability = higher urgency to get ready. Even high-probability setups can cancel. |
| Most triggers occur within X minutes | How quickly entries typically fire after a setup of this type is detected. | Helps you gauge how fast you need to move. "Within 15 minutes" means don't wander away from your platform. |
| Alert valid ~[time] | The approximate expiry time for this setup. If no Entry alert has fired by this time, the setup has expired. | After this time, stand down. Don't enter a trade expecting a delayed entry — the window has closed. |
| Options guidance | Specific instruction for options traders — e.g. "Start preparing put spreads on SPX/SPY." | LONG = put spreads. SHORT = call spreads. Use this time to pull up your chain and identify candidate strikes. |
| NOT CONFIRMED | Explicit reminder that no trade has fired. The entry alert will follow if conditions confirm. | Do not place any trade until the Entry alert arrives. |
How to Use the Setup Forming Window
The 5–25 minutes between the Setup Forming alert and the Entry alert is the most valuable part of the Phoenix service. It's what separates Phoenix from services that ping you at entry when it's already too late to position well. Here's how to use that window effectively.
- Note the direction — LONG or SHORT.
- Open your SPX 0DTE options chain in ThinkorSwim.
- LONG signal → navigate to the put side. SHORT signal → navigate to the call side.
- Identify candidate strikes in the 15–20 delta range, 20–25 points OTM.
- Check credits — you're looking for a spread that collects ~$2.00.
- Have your spread structure ready. When the Entry alert fires, you're selecting strikes and placing the order — not starting from scratch.
- Note the direction — LONG or SHORT.
- Log into your trading platform if you're not already.
- Pull up your NQ, MNQ, ES, or MES chart.
- Confirm your account is connected and you have buying power available.
- Have your order entry panel ready.
- When the Entry alert fires, you'll enter at market and immediately set your stop and target from the alert values.
What Happens Next
| What You See Next | What It Means | What to Do |
|---|---|---|
| Entry Alert | The setup confirmed. The trade is on. | Act immediately. Enter the trade and place closing orders. |
| Setup Canceled | Conditions changed. No entry was taken. | Stand down — but stay ready. A fresh setup can develop within minutes. |
| Nothing — alert valid time passes | The setup quietly expired without a formal cancel message. | Stand down. The window shown in the alert has closed. |
| Entry Alert with no preceding Setup Forming | Conditions developed and confirmed faster than the Setup Forming had time to print. | Act on the Entry alert immediately regardless of whether you saw a Setup Forming first. |
What Not to Do During the Setup Forming Window
Entry Alert — Every Field Explained
The Entry alert is the trade. When this fires you have seconds to act. This lesson breaks down every field so you know exactly what to do with each one under time pressure.
When This Alert Fires — Act Now
The Entry alert means Phoenix has entered a position on the signal machine. The trade is live. Your job is to execute your own position — futures or options — as quickly and cleanly as possible.
Speed matters here for two reasons:
- Price slippage — the further price moves from the alert entry before you execute, the less your fill matches the validated signal. More than 10–15 NQ points of slippage reduces the edge.
- The MFE window — for options traders, the favorable move that makes the spread profitable can last as little as 1–2 minutes. Every second between fill and closing order placement is a second you could miss it.
The Alert — Every Field Explained
| Field | What It Means | Your Action |
|---|---|---|
| Trade # | Sequential trade number for the session. Matches the Setup Forming and Exit alerts for this same trade. | Reference — used to match alerts when multiple trades fire in the same session. |
| Direction | LONG or SHORT — confirmed. This is the trade. Use this direction, not the one from the Setup Forming alert. | LONG = buy futures / sell put spread. SHORT = sell futures / sell call spread. Drill this until it's automatic. |
| Signal Time | The exact time Phoenix entered on the signal machine in Eastern Time. | Compare to current time. If more than a few minutes have passed and price has moved significantly, consider skipping. |
| Entry | The NQ price at which Phoenix entered the trade on the signal machine. | Futures traders: enter at market or near this price. Options traders: your spread entry is based on current SPX price, not this number. |
| Profit Target | Phoenix's profit target — shown in NQ points and dollar value per MNQ contract. | Futures traders: set a limit order at this price immediately after entry. Options traders: your GTC limit on the spread handles the exit. |
| Stop Loss | Phoenix's protective stop — shown in NQ points and dollar value per MNQ contract. | Futures traders: set a stop order at this price immediately after entry. Options traders: no price stop — your time stop handles the exit. |
| Options guidance — bias | Confirms the spread direction — e.g. "Bullish bias — consider selling put spreads on SPX/SPY." | Confirms which spread type to use. LONG = put spreads. SHORT = call spreads. |
| Close Spreads By | The 30-minute close-by time for options traders — exactly 30 minutes after the Signal Time. | Options traders: set your ThinkorSwim time stop for this exact time immediately after your opening fill. This is non-negotiable. |
| Win rate reminder | A reminder of Phoenix's historical win rate — e.g. "67% historical win rate." | No action — context only. Reminds you the edge plays out over many trades, not any single signal. |
The Direction Rule — Make It Automatic
Under time pressure, you don't want to be thinking about which spread to sell. This needs to be reflexive before your first live trade.
Futures traders: Buy NQ, MNQ, ES, or MES.
Options traders: Sell a PUT spread below current SPX price.
- Sell the higher-strike put (closer to price)
- Buy the lower-strike put (further OTM)
- You profit if SPX stays above your short strike
- Price moving UP moves you further from trouble
Futures traders: Sell NQ, MNQ, ES, or MES.
Options traders: Sell a CALL spread above current SPX price.
- Sell the lower-strike call (closer to price)
- Buy the higher-strike call (further OTM)
- You profit if SPX stays below your short strike
- Price moving DOWN moves you further from trouble
Should I Skip This Signal?
Not every signal will be perfectly timed for your situation. Here's how to decide whether to take a signal or pass:
| Situation | Recommendation |
|---|---|
| Price is within 5–10 NQ points of the alert entry | Take it — you're essentially at the same entry Phoenix got. |
| Price has moved 10–15 NQ points from alert entry | Use judgment — the edge is slightly reduced but the trade may still be viable. Consider sizing down. |
| Price has moved more than 15–20 NQ points from alert entry | Skip it — you're chasing. The edge is materially reduced. Wait for the next signal. |
| Exit alert has already posted | Do not enter — the trade is already closed. You've missed it entirely. |
| You're in a meeting, driving, or can't execute cleanly | Skip it — a rushed or distracted execution is worse than missing the trade. There will be another signal. |
| You already have an open position from a previous signal | Do not add — Phoenix trades one position at a time. Wait for your current position to close before acting on a new signal. |
Execution Checklist — Every Entry
Run through this every time an Entry alert fires. The goal is to make this sequence automatic.
Read the direction. LONG or SHORT. Take 3 seconds to confirm you have it right before touching anything else.
Check the signal time vs. current time. If it's been more than a minute or two, check how far price has moved. Decide whether to take it or skip.
Enter the position. Futures: market order. Options: sell the vertical at mid or market. Get filled.
Place closing orders immediately. Futures: set stop at Stop Loss price and limit at Profit Target price. Options: set GTC limit at ~75% of credit received and time stop at the Close Spreads By time.
Walk away. Your orders manage the trade. Watching it and second-guessing disconnects your results from the validated edge. Check back when the Exit alert fires.
Exit Alert & Setup Canceled
The Exit alert closes the loop on every trade. Here's every field, every exit reason, and what to do when you see each one — including the Setup Canceled message.
When the Exit Alert Fires
The Exit alert means Phoenix has closed its position on the signal machine. The trade is done. Your job at this point is simple: verify your position is flat.
If your closing orders did their job — your GTC limit filled on a winner, your time stop fired at 30 minutes, or your futures stop triggered — you may already be flat before the Exit alert arrives. That's ideal. Check anyway.
The Alert — Every Field Explained
| Field | What It Means | Your Action |
|---|---|---|
| Exit Reason | Why Phoenix closed the trade — Profit Target, Stop Loss, Breakeven, or Time Stop. This is the most important field in the Exit alert. | See the Exit Reasons section below for what each one means and what to do. |
| Signal Time | The exact time Phoenix exited on the signal machine in Eastern Time. | Reference — compare to your own exit time to assess how closely you tracked the signal. |
| Entry | The NQ price at which Phoenix originally entered the trade. | Reference — compare to your own entry fill to assess slippage. |
| Exit | The NQ price at which Phoenix exited the trade. | Reference — compare to your own exit fill. |
| Result | Points gained or lost and dollar value per MNQ contract. | Log this in your trade journal. Your own result may differ based on your fill prices and instrument. |
| Options guidance | Specific instruction for options traders based on the exit reason — e.g. "close spreads, edge was neutral" or "take profits on spreads now." | If your spread is still open, follow this guidance immediately. |
| Trade complete line | "Trade complete. Next alert when conditions align." Confirms this trade sequence is fully closed. | No action — confirmation that the next Setup Forming will start a new trade sequence. |
Exit Reasons — What Each One Means
There are four possible exit reasons. Each one has different implications for options traders — your spread may be in a different state depending on which reason appears.
Profit Target ?
The futures trade hit its profit target. Phoenix entered and the market moved in the signal's direction far enough to reach the target price. This is a full winner in futures.
Stop Loss ?
The futures trade hit its stop loss. The market moved against the signal direction far enough to trigger the protective stop. This is a full loser in futures — but remember that 80.8% of these trades were still profitable on the spread at the 30-minute mark due to theta decay.
Breakeven ??
The MFE breakeven mechanism triggered. The trade moved favorably enough to arm the breakeven stop, then reversed back toward entry, and the breakeven stop closed the position near entry for a small gain. Not a full winner but not a loser either.
Time Stop ??
The trade reached its 30-minute cap without hitting the profit target or the stop loss. Phoenix closed the position at market at the time stop. This happens on roughly 20% of trades and typically closes flat or near flat in futures.
Exit Reasons — Quick Reference
| Exit Reason | Futures Result | Likely Options Result | Action if Still Open |
|---|---|---|---|
| Profit Target | Full winner | GTC limit likely filled — profit | Close at market now |
| Stop Loss | Full loser | Time stop fired at 30 min — small profit or small loss | Close at market now |
| Breakeven | Small gain near entry | Small profit or flat depending on theta decay | Close at market now |
| Time Stop | Flat or near flat | ThinkorSwim time stop fired — small profit from theta likely | Close at market now |
The Setup Canceled Message
Setup Canceled is not an exit — it's a notification that a Setup Forming alert that fired earlier did not develop into a trade. No position was ever opened.
Important — Stay Ready After a Cancellation
A Setup Canceled does not mean trading is done for that session window. Conditions can reset quickly and a fresh setup can develop within minutes of a cancellation. Two scenarios to know:
After Every Exit — Your Checklist
The Core Concept
What Talon is, why it works, and why it asks more of you during the day than any other Aeromir strategy — in exchange for something specific.
What Problem Does Talon Solve?
Selling premium on SPX 0DTE iron condors is not a new idea. Plenty of traders do it, and the basic version works — collect credit from both sides, let most days expire worthless, take the occasional loss when price runs. The problem isn't finding the edge. The problem is the bad days.
Set expectations correctly from the start, because the reality is not what most people picture. The clean untouched winner is the uncommon outcome — roughly one condor in six. Most days, one side gets stopped and the other survives, which after costs is a scratch: no real gain, no real damage. Talon is not a strategy that usually wins big and occasionally loses; it is a strategy of many near-scratches, where the untouched days pay for the bad ones.
The bad ones are what matter. Price runs through one side, you take a loss there, and the other side — the one that was never in danger — is still sitting at full risk. Worse, the days that break one side often break the other later. That's a double stop, and it is the single largest source of drawdown in every mechanical condor program.
Talon exists to make those days cost less.
- One entry per day — the whole result rides on a single fill
- Strikes chosen by delta, so the buffer shrinks when volatility does
- Trades placed regardless of whether the premium is actually there
- Both sides stopped at the same distance all day — the surviving side keeps full risk after the first loss
- Stop levels set once and left to go stale as the day runs
- Fixed parameters that anyone can reverse-engineer and anticipate
- Up to six entries across the midday session — no single fill decides the day
- Strikes chosen by credit, so the buffer widens automatically when premium is rich
- If either side won't pay the target, that entry is skipped — by design
- After the first stop fires, the surviving side's stop tightens — that's the Defend Multiplier
- Stops are re-pegged at every entry time so they keep meaning what they meant at entry
- Parameters are drawn fresh each day and published each morning
The Insight Behind Talon
Talon is a systematic variation of the Multiple Entry Iron Condor — the MEIC approach popularized by Tammy Chambless. The lineage is real and worth stating plainly: the core structure is the same, and Talon's stop rule is close to the standard MEIC stop. What Talon adds is a rule for what happens after the first side is hit.
The observation is simple. When one side of a condor gets stopped out, the day has told you something. Price is moving with enough conviction to run through a strike you chose specifically because it was far away. The surviving side is no longer sitting in the calm, two-sided market you sold into — it is sitting in a trending market, and it is the side pointing away from the move.
A mechanical program leaves that surviving side alone, at its original stop distance, carrying full risk. Talon doesn't. The Defend Multiplier pulls the surviving side's stop in, so that if the day reverses and runs the other way, the second loss is smaller than the first.
The second ingredient is credit-first strike selection. Most condor programs pick a delta and take whatever credit that strike happens to pay. Talon inverts it: you are given a minimum credit per side, and you sell the farthest strikes that still pay it. On a rich day that pushes you further out of the money than a fixed delta would. On a thin day it pushes you closer — and if nothing pays the target, you don't trade that entry at all.
The Mechanics in Plain English
Strip away the theory and Talon does six things:
You read the day's parameters before the open.
Two numbers and a schedule: the minimum credit per side, the Defend Multiplier, and the day's entry times. They are published on the Talon Params page and posted to the alerts-talon-trades Slack channel at 9:00 AM Eastern. Both read the same source, so they cannot disagree.
At each entry time, you sell one $30-wide SPX 0DTE iron condor.
On each side, sell the farthest strikes that pay at least the credit target. If either side has nothing that qualifies, skip the entry entirely — skipping is part of the strategy, not a missed trade.
You place a stop on each short strike.
Enter your fill into the calculator on the Talon Params page — the condor's total credit and the mid price of each long strike — and it returns the exact stop level for each short. Single-leg stop-market orders on each short — one order watching one clean quote, rather than a spread stop triggering off a price computed from two.
At each later entry time, you refresh the stops on every open condor.
A stop level is built partly from what the long option is worth, and longs decay all afternoon. Re-reading those prices and updating the triggers — re-pegging — keeps each stop meaning what it meant when you placed it. It happens only at the six scheduled times, when you are already at the platform.
If a stop fires, you defend the surviving side.
The short is bought back automatically. You manually close that side's long, then move the surviving short's stop to the tighter level — the second number the calculator already showed you. This is the moment that requires your attention, and it is where Talon earns its difference from a mechanical condor.
Untouched condors settle themselves at 4:00 PM ET.
SPX index options cash-settle to the official closing price. There is no closing order for a condor that was never touched. Stops are day orders — nothing is held overnight, ever.
What Makes This Different From Other 0DTE Strategies
| Common 0DTE Approach | The Problem | How Talon Is Different |
|---|---|---|
| One condor per day | The entire day's result depends on a single entry at a single moment. A bad fill or an unlucky minute defines the session. | Up to six entries spread across the midday session. No single fill decides the day, and a bad entry is diluted by the others. |
| Strikes chosen by delta | A fixed delta pays whatever it pays. When premium dries up, you are taking the same distance for less money — exactly the wrong trade. | Strikes are chosen by credit. The distance moves with what the market is actually paying, and when nothing pays enough, the entry is skipped. |
| Both sides stopped at the same distance all day | After one side is stopped, the surviving side still carries full risk in a market that has just proven it can move. | The Defend Multiplier tightens the surviving side's stop after the first stop fires. Double-stop days cost less. |
| Stops set once and forgotten | A stop level is partly a function of what the long option is worth. As the long decays, the stop silently loosens — by afternoon it no longer means what it meant at entry. | Stops are re-pegged at each entry time, so the level tracks what it was designed to represent all the way through the session. |
| Published, fixed parameters | A strategy whose exact strikes and stops are public and unchanging can be anticipated by anyone who watches it long enough. | Parameters are drawn fresh each session and published the morning they apply — never in advance. |
The Time Commitment
This is where Talon differs most from Tachyon, and it deserves a straight answer rather than a comfortable one.
Half-hourly through the midday session. Each one is an entry plus a refresh of every condor already open.
12:00 to 14:30 ET. Not glued to the screen, but reliably available on the half hour — and free to respond if a stop fires between them.
Everything is 0DTE. Untouched condors cash-settle at 4:00 PM ET and stops are day orders. You start every morning flat.
The load is not even. Noon is one condor and two stops — a few minutes. By 2:30 you may be refreshing stops on five open condors and placing a sixth, and 2:30 is also the last refresh of the day, so those levels carry to the close. It is the busiest and most consequential moment in the session.
Talon is not a ten-minutes-a-day strategy. Tachyon is — one signal, one order, walk away. Talon asks for your attention across the middle of the trading day, on a schedule, with real work at each stop and a decision to make if a stop fires.
What Talon Is Not
Mismatched expectations cause more subscriber problems than anything else, so here is what this strategy does not do.
- It's not a strategy that makes more per trade than a standard MEIC. The returns are comparable. The improvement is in the size of the losing days, not the size of the winning ones. If you are looking for higher returns rather than smaller drawdowns, Talon is not making the trade you want.
- It's not set-and-forget. Your stops rest with your broker and work without you watching — but they are refreshed at every entry time, and the defend step after a stop is manual and time-sensitive. Place the stops once and ignore them and you are running a different strategy from the one the published figures describe.
- It's not a fixed recipe you learn once. The credit target and Defend Multiplier are published fresh each morning. There is no memorizable set of numbers, and no way to get today's values in advance.
- It's not a guarantee that double-stop days won't hurt. They still lose money. The defend rule makes them cost less — it does not make them profitable, and it does not prevent them.
- It's not a width you get to choose. The condor is $30 wide, fixed. Position size is expressed in contracts, never by narrowing the spread. Changing the width changes the strategy.
- It's not the same as Phoenix or Tachyon. Phoenix trades directional spreads off futures signals with active profit management. Tachyon enters once at 15:51 and lets settlement do the rest. Talon is a midday, multi-entry, two-sided program with an active defense rule. All three can be traded alongside each other — they don't overlap.
What to Expect in This Module
The remaining lessons cover everything you need to trade Talon correctly from your first live session:
- Lesson 2 — Reading Today's Parameters — the two daily numbers, where to find them, why they change, and the habit that keeps you from trading yesterday's values.
- Lesson 3 — Strike Selection: Credit First, Not Delta — finding the farthest strikes that pay the target, and why skipping an entry is a correct outcome.
- Lesson 4 — Structuring the Condor — the $30-wide structure, both sides, and what the total credit means.
- Lesson 5 — The Defend Multiplier — the rule that makes Talon different, worked through with real numbers.
- Lesson 6 — Placing Your Stops — single-leg stop orders, the calculator, and re-pegging at each entry time.
- Lesson 7 — Entry Order Structure — the full loop, run cleanly, six times a day.
- Lesson 8 — Position Sizing Across Multiple Entries — sizing for six simultaneous condors, and what your real worst case looks like.
- Lesson 9 — Letting It Settle — cash settlement at 4:00 PM ET, day orders, and reading the day's outcome.
- Lesson 10 — How Talon Was Built — the research behind it, the MEIC benchmark, and why honest fills matter more than backtest headlines.
The Defend Multiplier
The rule that separates Talon from a mechanical iron condor. What it does, why it exists, and the arithmetic behind the number you are given each morning.
The Situation It Was Built For
It is 1:15 PM. You sold a condor at noon, both sides comfortably out of the money. SPX has since dropped hard, your short put stop has fired, and that side is closed at a loss.
Now look at what you are holding. The call side is still open, still far out of the money, still quietly profitable. Every instinct says it is the safe side — the market is running away from it.
But the day has told you something. Price moved with enough conviction to run through a strike chosen specifically because it was far away. This is no longer the calm, two-sided market you sold into. It is a trending market, and trending markets reverse.
Talon does not leave it alone. The Defend Multiplier pulls the surviving side's stop in, so that if the reversal comes, the second loss is smaller than the first.
First, the Stop Before Any Defending
You cannot understand the defend rule without the base rule, so start there.
Both stops peg to the total condor credit — both sides added together, not the per-side target. The level is that total, less a ten-cent buffer:
Defense level — the cost to close a tested side
total credit − $0.10
That level is a spread value — what it would cost to buy back the tested vertical. But your stop order sits on the short leg alone, so you convert by adding back what that side's long option is worth:
Stop price for that side's short strike
defense level + that side's long mid
Each side uses its own long. The put stop adds the long put's mid; the call stop adds the long call's mid. Both start from the same defense level, because both peg to the same total credit.
Why Total Credit, and Why Minus a Dime
Two questions people reasonably ask about that formula. Both have arithmetic answers.
Why the total, not the side's own credit?
Follow the cash. You collected $2.35 on the whole condor. If one side goes against you and you buy it back for $2.35, you have spent exactly what you took in — breakeven. If you had instead pegged to that side's own credit of $1.15, you would be closing at a point where you had spent $1.15 of $2.35, still holding the other side, and nowhere near the risk the position actually carries.
Why subtract ten cents?
Closing at exactly the total credit is breakeven on the tested side. The ten-cent buffer stops you a fraction earlier — so the tested side is closed slightly before it has consumed the entire credit, leaving a dime on the table in your favor. It is a small, deliberate profit lock, and it is applied once, to the defense level, not to each leg.
If you know the standard MEIC stop, this will look familiar — it is that rule, minus a dime. Talon is not reinventing the base stop. What follows is the part that is new.
What Changes After the First Stop
The moment one side stops out, the surviving side re-derives its stop using today's Defend Multiplier. Same shape as before — the multiplier simply scales the credit down first:
Defended level
(total credit × defend multiplier) − $0.10
New stop for the surviving short
defended level + surviving side's long mid
Because the multiplier is below 1.00, the defended level is always lower than the original — the surviving side now exits sooner. A multiplier of 0.875 means the survivor closes once it costs about 87½% of what would originally have triggered it.
Round up to a tradable price
SPX options quote in $0.05 increments below $3.00, and $0.10 at or above it. Your arithmetic will usually land between two of them — and a stop trigger has to be a price that exists. Round up to the next tradable increment. If the arithmetic already lands on one, leave it alone.
Up sounds like the wrong direction, and it is worth a sentence on why it is not. The short's quote can only ever be one of those increments — there is no such thing as a bid of $2.57. A trigger of $2.57 therefore fires on the first bid of $2.60, and a trigger written as $2.60 fires on exactly the same quotes. Rounding down to $2.55 does not make the stop safer. It makes it a different stop — one that also fires at $2.55, a price the arithmetic never said to exit at.
This is not a preference. The published figures come from an engine that triggers on the exact, unrounded level; rounding up reproduces that trigger and rounding down does not. When the tested history was re-run with stops rounded down, the extra early exits turned dozens of full wins into losses and reduced net profit — while modestly improving the stress-tested risk measure. We match the tested trigger.
The Whole Thing, With Numbers
Carrying forward the condor from Lesson 4, with today's Defend Multiplier at 0.875:
| Input | Value |
|---|---|
| Total condor credit | $2.35 |
| Long put mid (7495) | $0.32 |
| Long call mid (7875) | $0.25 |
| Defend Multiplier | 0.875 |
At entry — both sides armed
- Defense level = $2.35 − $0.10 = $2.25
- Short put stop = $2.25 + $0.32 = $2.57 → rounds up to $2.60
- Short call stop = $2.25 + $0.25 = $2.50
SPX drops. The put side stops out.
The short put is bought back automatically at $2.60. You close the 7495 long manually — it has value, and leaving it dangling means holding a lottery ticket you did not intend to own. The put side is now flat, at a realized loss.
The call side re-derives
- $2.35 × 0.875 = $2.0563
- Defended level = $2.0563 − $0.10 = $1.9563
- New short call stop = $1.9563 + $0.25 = $2.2063 → rounds up to $2.25
You cancel the $2.50 stop and replace it with $2.25. That single action — taking maybe fifteen seconds — is the entire Defend Multiplier.
These are the exact arithmetic, before rounding to a tradable price; rounding moves them by a few dollars, and commissions and slippage move them further. Treat them as the design arithmetic rather than a promise.
The Defended Level Re-Pegs Too
One detail that follows from Lesson 6 and is easy to miss: the defended stop is built from the same two halves as the original, and the same half goes stale.
The defended level — credit × multiplier − $0.10. Both inputs are fixed for the day, so this number never moves once the condor is filled.
The conversion — the surviving side's long mid. It decays all afternoon exactly like any other long, so the defended trigger keeps changing even though the defended level does not.
So a defended side is re-pegged at each remaining entry time like any other open side — you refresh that long's mid, and the trigger comes down again. It is the same routine, just starting from the defended level instead of the original one.
One consequence for the arithmetic above: the ~$29 saving assumes the reversal comes soon after the first stop. If the first stop fires at noon and the reversal at 2:45, both the original and defended triggers will have been re-pegged downward in the meantime, and the actual figures differ. The mechanism is unchanged — the defended side always exits sooner than it otherwise would — but the exact saving depends on the day.
Why This Improves Drawdown but Not Returns
It would be easy to present the defend rule as free money. It is not, and the honest version is more useful — it explains exactly what Talon is buying.
A tighter stop does two things at once, in opposite directions:
Every double-stop day costs less. The second loss is smaller by the full difference between the original and defended levels — and double-stop days are precisely the days that carve out the drawdowns. Measured across four years: the average double stop falls from about −$159 to about −$126.
A tighter stop is easier to hit. Some surviving sides that would have drifted back and expired worthless now get stopped instead — small losses that would not otherwise have happened. Measured: about a quarter more double-stop days, 637 becoming 803.
Those two effects very nearly cancel in total dollars — and we can put numbers on it, because the strategy was run over the same four years with the defend rule switched off as a control.
| Same days, same everything else | Defend OFF | Defend ON |
|---|---|---|
| Double-stop days | 637 | 803 — more of them |
| Average cost of a double stop | −$159 | −$126 — each one cheaper |
| Net profit | $53,283 | $52,480 (−1.5%) |
| Stress-tested drawdown | $5,699 | $5,250 (−8%) |
That is the whole rule in four rows. It takes more losing days and makes each of them smaller, and the two effects nearly offset — the defense costs about 1.5% of net profit and buys roughly an 8% reduction in the stress-tested drawdown. A real improvement, precisely located, and not free.
Whether that is a good trade depends on what limits your size. For most traders it is capital and nerve, and both are governed by the worst stretch rather than the average one.
Doing It Under Pressure
The mechanics are trivial. The context is not — you will be doing this having just taken a loss, while the market is moving.
Close the orphaned long.
The short was bought back for you; the long was not. Close it. Keeping it is an unplanned directional position you did not choose.
Read the defended stop off the calculator.
It is the second number in that condor's row, already computed. If the row's mids were refreshed at the last entry time, use it as it stands; if the last re-peg was a while ago, refresh that side's mid first.
Cancel the old stop, place the new one.
Same short strike, lower trigger. Cancel first, so you never briefly hold two live stops on one leg.
Ways People Get This Wrong
- Not doing it. The most common failure. Skip the defend step and you are running a measurably different strategy from the one behind the published figures — one with a stress-tested drawdown about 8% larger. It is not the whole of Talon's edge over the benchmark, but it is the part that is yours to execute, and it is the only part that can be lost through inattention.
- Applying the multiplier to the side's own credit. Everything pegs to the total condor credit — before and after defending. Using the per-side figure roughly halves every stop and will close positions that were never in trouble.
- Applying it at entry. The defended level only exists once a side has actually stopped out. Arming both sides at the tighter level from the start is a different, untested strategy.
- Applying it twice. The multiplier is used once per condor. A defended side that gets re-pegged later is refreshing its conversion, not multiplying again.
- Defending the wrong condor. Each entry is independent. A stop on the 12:00 condor tightens the 12:00 condor's surviving side and nothing else. The 13:30 condor keeps its own levels.
- Leaving the orphaned long open. A lone long option after its short has been closed is a directional bet with a nasty habit of looking clever for twenty minutes.
- Widening it back after a bounce. Once defended, that side stays defended for the rest of the session. Re-pegging only ever moves the trigger to match current prices — it never returns the side to its original level.
Putting It Together
- Both stops peg to the total condor credit, less a $0.10 profit lock
- The stop order sits on the short leg, so add that side's long mid to convert
- When one side stops, the survivor re-derives at credit × multiplier − $0.10, plus its own long mid
- The multiplier is applied once; the long-mid conversion is refreshed at every entry time
- Round the trigger up to the next tradable increment — nickels below $3.00, dimes at or above — and leave it where it is if the arithmetic already lands on one
- Per condor, and only after a stop has actually fired
Position Sizing Across Multiple Entries
Talon can put six condors to work in an afternoon. Sizing it means understanding what six positions on one underlying actually cost you — in buying power, in capital, and in the worst stretch you will have to sit through.
The Unit of Size
Talon has exactly one sizing lever: contracts per entry. You trade one condor at each scheduled time, and you choose how many contracts that condor is.
- Not width. The $30 wing is structural. Narrowing it to reduce risk produces a different strategy with different stop arithmetic.
- Not the number of entries. Trading three of the six is not “half size” — it is a different, untested strategy that happens to use Talon's parameters.
- Not selectively skipping. Taking only the entries that look good is discretion wearing a systematic costume.
What Six Condors Tie Up — and What They Need Behind Them
These are two different numbers, and confusing them is the most common sizing error in strategies like this. Start with the smaller one.
An iron condor is margined at one side's width less the credit received, because only one side can finish in the money. Using the running example — $30 wide, $2.35 credit:
$3,000 width less the $235 collected.
Six condors on at once, if every entry fills. This is margin — what the broker demands. It is not the account you need.
The certified funding figure behind the published results — roughly twice the peak margin. Why twice is explained below.
Why the account needs to be about double the margin. The certified sizing rule funds each contract of size at the larger of two requirements:
- Enough that the stress-tested drawdown is at most 20% of the account. Talon's stress-tested drawdown is $6,139 per contract (next section); divided by 20% that asks for about $30,700.
- At least twice the peak buying power. An account sized exactly to its margin has no room for anything — no cushion for a drawdown, no headroom when requirements shift intraday as a strike approaches the money, and nothing spare when a defended day and a full book coincide. Doubling the ~$17,100 certified peak asks for $34,190 — and being the larger number, this is the one that binds.
Running at the edge of your buying power means the market decides how many entries you take — which is not a decision you want delegated. The 2× rule exists so that never happens.
What a Condor Actually Costs You — and How Often
Buying power tells you what you can hold. It says almost nothing about what a bad day costs, because stops mean a condor almost never runs to full width. Per contract, using the running example, with how often each ending actually occurred across the four-year certified record:
| Outcome | What happened | Result (design) | After ~$1.20/leg costs | How often |
|---|---|---|---|---|
| Untouched | SPX settled between the shorts. Everything expired worthless. | +$235 | +$230 | about 1 in 6 |
| One stop, survivor holds | One side stopped near breakeven; the defended side was never tested. | +$10 | about $0 | about 2 in 3 |
| Double stop | One side stopped, then the market reversed and took out the defended side. | −$186 | about −$196 | about 1 in 6 |
Read the frequency column before anything else, because it is the opposite of what most people expect. The clean full win is not the normal outcome — it is the uncommon one. Five of every six condors get a side stopped. Roughly half of all condors book a small loss — and the median losing condor across the whole record lost under ten dollars. Talon is not a strategy that usually wins and occasionally loses; it is a strategy of many near-scratches, where the untouched days pay for the double-stop days.
That middle row is the dime buffer doing its work — and after commissions it is a true scratch, roughly zero rather than a small win. A condor that gets tested on one side and survives on the other is not a loss. Being tested is not the same as losing. If a stopped side rattles you, this table is the correction: it is the single most ordinary event in the strategy, happening somewhere in your book on most days.
The double-stop design figure is deliberately pessimistic: across the certified record the average double-stop cost about $130 rather than $190, because stops usually fire before the full deterioration the arithmetic assumes.
The Day That Hurts Is Not the One You'd Guess
Six condors are not six independent bets. Same underlying, same expiration, same afternoon — when the market moves, it moves through all of them. But how it moves changes the outcome completely, and this is now measured rather than argued.
SPX trends down through the afternoon. Put sides stop out one by one; call sides drift further from danger and expire worthless.
Most condors land on the scratch row. Later entries are placed after the move, re-centered on the new price, so they may not be tested at all. Uncomfortable to watch, cheap to hold.
Down hard through lunch, then back up through the afternoon. Put sides stop on the way down; call sides stop on the way back.
Multiple condors land on the double-stop row simultaneously. This is the day that defines Talon's drawdown — and the day the Defend Multiplier exists for.
Here is the measurement. Split the four-year record into down-days, flat days, and up-days: on down-days, put sides stopped on 79% of days while call sides stopped on 24%. On up-days it mirrors almost exactly — call sides 76%, put sides 27%. Pool everything together and the two sides come out even. The market's direction decides which side stops; it does not change the fact that on most days, some side stops. A one-way day converts almost entirely into scratches. Only the reversal takes both.
Size for the whipsaw, not the crash. A trend day is survivable almost by construction. A reversal day stops both sides of several condors, and the losses arrive together because the positions were never independent to begin with.
Choosing Your Size
Two constraints. The binding one is almost never the one people check first.
Capital — the floor.
$34,190 per contract of size. The certified funding figure — enough to carry the full six-condor book at twice its peak margin, with the stress-tested drawdown capped below a fifth of the account. This sets the maximum size your account can responsibly carry.
Drawdown tolerance — the real answer.
The worst stretch you can sit through without abandoning the strategy. Divide that dollar figure by $6,139 per contract — the stress-tested drawdown — and round down.
Almost everyone can carry more contracts than they can comfortably watch lose. Capital tells you what is possible; drawdown tolerance tells you what is sustainable. The second number is smaller, and it is the one to use.
The drawdown numbers, plainly
- $3,021 per contract — the worst peak-to-valley drawdown the strategy actually recorded across four years.
- $6,139 per contract — the stress-tested figure: replay the same four years of daily results in thousands of shuffled orders and take the 95th-percentile worst drawdown. History dealt one ordering; this asks what the same results could have cost in an unluckier sequence. Size to this one, not to the $3,021 — the realized path is a single draw, and you will not get the same draw.
- Every rolling 12-month window in the record made money — the worst full year still finished up about $1,980 per contract.
- But not every 6-month stretch did. The worst six months lost about $960 per contract. A losing half-year is inside the strategy's ordinary behavior, and it will not announce itself as ordinary while you are in it.
The test worth applying: imagine the worst stretch happening in your first month. Concretely — a drawdown of $6,139 per contract, arriving before the strategy has banked you anything, followed by months of grind back. If that size would make you stop trading the strategy, it is too big — not because the risk is unacceptable, but because abandoning a strategy mid-drawdown is how you capture the losses and none of the recovery.
Scaling
Size in whole contracts per entry, applied uniformly.
- Every entry gets the same size. Two contracts means two at all six entries. Varying size by entry — heavier at noon, lighter at 2:30, bigger after a loss — is a discretionary overlay on a systematic program.
- Scale on account growth, not on results. Adding size after a good week and cutting after a bad one is performance-chasing. The strategy's edge does not vary with last week.
- Never scale to recover. Doubling up after a drawdown converts a strategy with bounded risk into one without. This is how accounts end, and it always feels reasonable at the time.
- Check the arithmetic before adding a contract, not after. Each additional contract asks for another $34,190 of account, of which roughly $16,600 will show up as margin on a full-book day — and you find out whether you had it on the day every entry fills.
Ways People Get This Wrong
- Sizing off one condor. The number that matters is six at once, funded at double. Sizing to what a single condor requires means running out of buying power somewhere around the fourth entry — on the days when every entry fills, which are the busy days.
- Sizing off the margin instead of the capital. ~$16,600 is what the broker demands; $34,190 is what the strategy needs behind it. An account that covers the first and not the second is fully invested in its own margin requirement, with nothing left to absorb the drawdown it is guaranteed to eventually meet.
- Assuming the six diversify. They are the same underlying on the same afternoon. A reversal reaches all of them.
- Sizing off maximum theoretical loss. The $2,765 figure describes a condor with no stops — an event that has never once occurred in 4,971 tested condors. Sizing to it produces a position so small the strategy is not worth trading.
- Sizing off the average day. The opposite error and the more expensive one. Averages do not make you quit; drawdowns do.
- Expecting mostly clean wins. The full win is one condor in six. If your sizing only feels right on the days everything expires untouched, it is wrong five days out of six.
- Trading fewer entries to fit a smaller account. Not a smaller version of Talon — a different strategy with different behavior.
- Narrowing the width to fit. Same problem, and it breaks the stop arithmetic as well.
- Running at the edge of buying power. The market ends up choosing which entries you take.
Putting It Together
- Size in contracts per entry, applied equally to all six
- Fund $34,190 of capital per contract — about twice the ~$16,600 peak margin, and that doubling is the point
- The full win is 1 condor in 6; most condors are near-scratches; the untouched days pay for the double-stops
- No condor in the certified record ever reached full width — the worst lost a third of it; the wings cover the case nobody models
- The expensive day is a whipsaw, not a trend — direction decides which side stops, only a reversal takes both
- Capital sets the ceiling; drawdown tolerance ÷ $6,139 sets the size — and a losing six-month stretch is ordinary behavior
- Scale on account growth, in whole contracts, never to recover
Letting It Settle
What happens to an untouched condor at 4:00 PM, why there is no profit target, and why the end of a Talon day requires nothing from you at all.
“No Exit Management” — Precisely
Talon plainly does manage exits. Two stops go on every condor, and a stop firing triggers a manual defend step. So it is worth being exact about what this lesson claims.
Talon has no discretionary exits. Every way out of a position is defined in advance by a rule:
- A stop fires — the rule decided, at a level computed at entry
- The other side is defended — the rule decided, using today's multiplier
- Nothing happens — settlement decides, at 4:00 PM
There is no fourth path. No profit target, no closing early because a position looks uncomfortable, no flattening at 3:30 to avoid the close. Once a condor is on and both stops are working, you have no further decisions to make about it.
How Cash Settlement Works
SPX index options settle in cash, not shares. There is no underlying to be assigned, nothing to deliver, and no position to inherit. At expiration the exchange computes what each option is worth and the difference lands in your account.
- Cash-settled — no shares change hands
- European style — cannot be exercised early, at all
- Settle against the official 4:00 PM close
- Worthless options simply vanish from the account
- Early assignment on a short leg
- Waking up holding a large equity position
- Needing to close before the bell to avoid exercise
- Pin risk on the underlying shares
If you have traded credit spreads on equities or ETFs, a good deal of habitual caution stops applying here. The assignment anxiety that drives early closing on SPY spreads has no equivalent in SPX. There is nothing to be assigned.
The Three Ways a Condor Ends
Every filled condor finishes in one of three states. Per contract, using the running example:
| Ending | What you do | Result | After costs | How often |
|---|---|---|---|---|
| Untouched — settles | Nothing at all | +$235 | +$230 | about 1 in 6 |
| One stop, survivor settles | Close the orphaned long, tighten the survivor. Then nothing. | about +$10 | about $0 | about 2 in 3 |
| Double stop | Close both orphaned longs. Position is flat before the close. | about −$186 | about −$196 | about 1 in 6 |
Commissions are charged on four entry legs always, plus two exit legs on each side that stopped; expired legs cost nothing. The design figures assume the stop deteriorates fully — across the certified record the average double stop actually cost about −$130 rather than −$186, because stops usually fire before that point.
Two of the three require nothing from you at the close. The untouched condor settles itself. The one-stop condor was dealt with when the stop fired, hours earlier. Only the double stop leaves you actively closing anything, and even then you are closing a long, not managing a position.
Why There Is No Profit Target
Most condor traders take profits early — close at 50% of max, bank it, move on. Talon does not, and the reason is arithmetic rather than philosophy.
Look at what a profit target actually changes. Your losses are unaffected: a stop fires at the same level whether or not you had a target. Your winners are cut: the full $235 becomes $118. So a 50% target keeps every loss the same size and halves every win.
The winners have to pay for the losers.
A double-stop day costs roughly the credit from eight untouched condors. That maths only works if untouched condors deliver the whole credit.
Closing early costs you twice.
You give up the remaining premium and pay the spread to get out — on a position that would have cost nothing to let expire.
The last hour is when the premium is earned.
0DTE decay is fastest at the end. Closing at 2:30 to lock in a partial gain surrenders exactly the stretch you were being paid to sit through.
When a Condor Settles Slightly In the Money
Occasionally a condor reaches 4:00 PM with SPX just past one of your short strikes, and no stop ever fired. It looks alarming and it usually is not — and “occasionally” can be made precise: across 4,971 condors in the certified record it happened twice, settling 0.47 and 0.27 points past a short, costing $47 and $27 per contract. It is a rare event with a small price tag, not a lurking disaster.
The reason is that your stop trigger sits above the point where the condor breaks even. If price is barely through the strike — not enough to have driven the short's price to the trigger — then what you pay at settlement is less than what the stop would have cost you.
- SPX settles 1 point through the short put: that side is worth $100, you collected $235 — still a profitable day.
- Further through: the loss grows point for point, but the long wing 30 points out caps it absolutely.
- A late gap in the final minutes is the case that can move past the stop without triggering it in time. Rare, and precisely why the long wings are there.
At 4:00 PM
The instruction for the close is genuinely: do nothing.
- Untouched condors settle automatically. No order, no action.
- Unfired stops expire with the session.
- Anything you already closed after a stop is done and gone.
- Skipped entries never existed. Nothing to reconcile.
Settled cash usually posts shortly after the close, sometimes the following morning depending on the broker. There is nothing to chase.
Worth recording, though
A short note per condor — entry time, strikes, credit, whether it was tested, how it ended — takes a minute and gives you something concrete when you want to know whether a rough stretch is unusual or ordinary. Your own record is the only one that reflects your fills. There is a trade journal built into the member site for exactly this; it is quicker than a spreadsheet and it keeps the fields consistent.
Ways People Get This Wrong
- Closing early because it looks scary. A condor whose short is being approached is doing exactly what it does most days. The stop is the response, and it is already in the market.
- Adding a profit target. Same losses, smaller wins, no evidence. The most tempting change and one of the most damaging.
- Closing before the bell out of assignment fear. SPX is cash-settled and European. There is nothing to be assigned and nothing to exercise.
- Leaving orphaned longs open. After any stop, that side's long is a naked directional position. Close it.
- Leaving stops as GTC. A day order dies with the session; a GTC stop can outlive the position and fire against something else entirely.
- Re-entering after a stop. There is no replacement trade. The next entry is on the schedule, at its own time, or not at all.
Putting It Together
- SPX options are cash-settled and European — no assignment, no early exercise, nothing to deliver
- Untouched condors settle themselves at 4:00 PM; unfired day stops expire alongside them
- Every exit is defined by rule — no profit target, no discretionary close
- A slight breach at settlement usually costs less than the stop would have
- After any stop, close the orphaned long and be flat on that side
How Talon Was Built
The research behind the strategy, the benchmark it was measured against, and why the way a backtest models its fills matters more than the number it prints at the end.
Why This Lesson Exists
You do not need this lesson to trade Talon. Lessons 1 through 9 are sufficient — read the parameters, sell the condor, place the stops, defend if tested.
It exists because you are about to put real money behind rules somebody else wrote, on the strength of results you cannot independently verify. That deserves an account of how those results were produced and where they are weakest — not a highlight reel.
Mechanism Before Backtest
The order of work matters more than most people expect. Talon started with a question about market behavior, not a search through parameters for something that looked good.
The question was the one in Lesson 5: when one side of a condor gets stopped out, has the day told you something about the other side? There is a plausible reason to think so — a move with enough conviction to run a far strike is not the calm two-sided market you sold into. That reasoning came first. The test came after.
- Propose why an effect should exist
- State what would confirm or refute it, in advance
- Run the test
- Accept the answer either way
- Search parameters for a good-looking result
- Construct an explanation afterward
- Publish the best one found
- Discover live that it does not repeat
The second column produces better-looking numbers, reliably. Search enough combinations and something will always shine — it just has no reason to keep shining once your money is on it.
Honest Fills
If you take one thing from this lesson, take this. It is the single largest difference between a backtest that describes reality and one that describes a fantasy, and it almost never appears in published results.
Every backtest has to decide what price a trade got. The tempting choice is the midpoint between bid and ask — it is available, it is tidy, and it makes everything look better. It is also not a price anyone is obliged to give you.
Talon's model does not treat both ends of a trade the same way, and the asymmetry is deliberate. Here it is in full, including the half that flatters us.
Entries are priced at the midpoint. the generous half
The credit is booked at the mid of the bid/ask, with no execution cost charged for getting filled. This is what essentially every published condor result does, and we do it too — but it is worth saying out loud rather than leaving you to assume otherwise. Commissions and exchange fees are charged on every entry; what is not charged is the cost of crossing the spread.
Stop exits are priced where you would actually buy back — on both legs.
Not the midpoint. The short is bought back at the offer and the long is sold at the bid, from the real quotes at that moment, so the model pays the full spread on both sides of the trade it is closing. It also keeps the trigger and the fill separate: the stop is triggered by the short's bid and filled at its ask, which are different numbers and are treated as different numbers. This is where mid-fill results flatter themselves most, and it is the half that decides whether a stopped-condor backtest means anything.
Closing the orphaned long is modeled too, with a delay.
You cannot close it in the same instant the stop fires — you have to notice and act. The model waits 30 seconds after the short's fill and then sells the long at whatever the bid is by then, not at the price it was worth when the stop went off. If the bid has gone to zero, it recovers nothing; it is never marked to a midpoint that nobody would have paid.
What this means for you, practically. If you give up a nickel to get filled, you will trail the published figures by roughly that nickel per condor, per contract — about $5 on a trade the model books at $235. Not fatal, worth knowing, and largely inside your control: the fix is patience at the entry, not a change to the strategy.
Honest fills make every number smaller. That is the point. A figure you can defend is worth more than one you have to walk back — and a disclosure you volunteer is worth more than one somebody else finds.
The Benchmark
“This strategy made money” is close to meaningless without a comparison. Talon is measured against a mechanical MEIC — the multiple-entry iron condor approach popularized by Tammy Chambless, run with fixed parameters and no defend rule, on the same days, through the same engine, with the same fill rules and the same commission basis.
That is a deliberately demanding benchmark. It is not a straw man and it is not zero. It is a real strategy that real traders run successfully. It differs from Talon in three ways that all matter: no defend rule, a wider spread (40 or 50 points against Talon's 30), and a fixed credit target rather than a rotating one. Both widths are shown, because which one a MEIC trader runs changes the comparison.
| Measure | Talon | MEIC 40-wide | MEIC 50-wide |
|---|---|---|---|
| Net, per contract, four years | $53,134 | $45,435 | $46,621 |
| Profit per trade | $10.69 | $9.83 | $13.08 |
| Stress-tested drawdown (95th percentile) | $6,139 | $15,040 | $13,665 |
| Profit per unit of that risk | 8.65 | 3.02 | 3.41 |
| Worst realized drawdown | $3,021 | $9,360 | $9,157 |
| Rolling 12-month windows that made money | 100% | 91.97% | 90.96% |
Read the top two rows and the bottom four as two different stories. On profit the three are in the same neighbourhood — the differences are not large enough to call a winner, and the 50-wide actually earns more per trade, partly because it skips days it cannot construct and so averages over a smaller, self-selected set. On risk there is no contest: Talon carries roughly a fifth to a quarter of the stress-tested drawdown at broadly similar profit.
The comparison continues in public. The same three arms — Talon, MEIC 40, MEIC 50 — are scored on every trading day and posted at aeromir.com/talonResults, including the days the data quality gate refuses to score. Four years of history is the evidence; the daily feed is verification that the relationship still holds.
What It Assumes About Costs
A backtest that ignores transaction costs is not describing a tradable strategy. Talon's figures are net of a full cost model, and it is worth knowing which one, because the number is higher than most published results use.
Per contract, per leg, per event, all-in — commission plus the exchange and regulatory stack. This is the Schwab figure verified from real statements: the subscriber who opened an account and changed nothing. Every published Talon number sits on this.
Published as sensitivity. Roughly where a volume-tiered account at a higher-cost broker lands.
Published as sensitivity. The pessimistic end — some brokers add an index execution surcharge nobody else itemizes.
How the charge works. Entry legs are always charged — four of them per condor. Exit legs are charged only on a side that actually stopped, two more. Legs that expire are free, because SPX cash-settles and there is no closing trade. So an untouched condor pays four legs, a one-stop condor six, a double-stop condor eight.
Walk-Forward, Not One Good Stretch
A strategy that worked over a long period may have worked in only part of it. Split the history into separate stretches and test each independently, and a surprising number of published strategies turn out to be one good year wearing a disguise.
Talon's validation requires it to hold up in separate sub-periods, not just in aggregate. A result that clears the overall test but fails on an individual stretch is treated as a failure, not as noise to be explained away.
The related discipline is not searching for the best-looking configuration. Test enough parameter combinations and one will look excellent purely by chance. Talon's parameters were chosen from a region that works broadly, which is also why they can rotate day to day without the strategy falling apart.
What the Rotation Costs
Lesson 2 explained why the daily parameters rotate. This is what it costs, because it does cost something and you should know which part.
Essentially free. Moving the multiplier around within its range has almost no measurable effect on results — the defend rule is robust to the exact value.
Not free. The credit axis carries essentially all of the rotation's cost — a measurable reduction in capital efficiency compared with sitting on a single fixed value.
The Data Behind It
Results are only as good as the prices they were computed from. Talon is built on tick-level quote data — the actual sequence of bids and offers through the day, not end-of-day snapshots or interpolated bars. That is what makes honest fills possible: you cannot claim a marketable price unless you can point to the quote.
An episode worth telling
Late in validation, a benchmark run turned up something odd. The vendor's quote archive contained a small number of physically impossible quotes — prices that could not have existed in a functioning market, including spread prices worth more than the spread's own maximum value.
They mattered because of exactly where they landed. An impossible quote can trigger a stop fill that could never have happened, at a price that could never have been paid, and every one of those distorts the result. On one certified ledger the distortion ran to roughly 12%. That is not a rounding error; it is the difference between a defensible number and a wrong one.
The response was not to delete anything. Deleting inconvenient days is indistinguishable from cherry-picking, and the tick archive is treated as a permanent record that is never edited. Instead: a structural validity check was written, the affected history was replayed through it, every repriced row was logged with its own before-and-after, and every affected artifact was rebuilt and re-issued against those logs. The corrupt class the check was built to catch went to zero, and each change reconciles to a logged entry rather than being asserted.
The reason to tell you this is not that it was dramatic. It is that this happened before publication rather than after a subscriber noticed, and it is the standard of care behind the numbers you are being asked to trust.
What the Published Figures Assume About You
A backtest scores a specific policy. If you trade a different one, the figures describe someone else's strategy.
Talon's published results assume you do the things this course teaches:
- All six entries, at the scheduled times — not a selected subset
- Credit-first strikes, taking the farthest qualifying strike and skipping when neither side qualifies
- $30 width, always
- Stops re-pegged at each entry time — this is why Lesson 6 asks for it, and it is the most commonly skipped requirement
- The defend step performed promptly when a stop fires
- No profit targets, no discretionary exits
What We Don't Know
Every strategy has an honest list of these. Here is Talon's.
- The tested history is finite. It covers roughly four years of SPX 0DTE trading, which is a market that has changed considerably in that time and may change again. Nothing in the testing anticipates a regime the data never contained.
- Your fills will not be the model's fills, and the entry side is unmeasured. Exits are modeled at real marketable prices on both legs. Entries are modeled at the midpoint, and that convention has never been checked against what subscribers actually fill — the little evidence we have is a single trade on a sibling strategy, and it went against the model. Treat the entry convention as the model's most optimistic assumption.
- No condor in the tested record ever reached its full width — but that is partly a property of the model. The worst single entry lost about a third of full width, and the stop threshold sits well inside the wing, so the model has no path to a full-width loss. Read it as the stop protected every time it was modeled, not as evidence about how often a stop can fail in the real market. Nothing in the testing prices a stop that does not fill.
- The defend rule is validated as a rule, not as a specific value. Tightening the surviving side after the first stop holds up across testing. The exact multiplier matters far less, which is why it rotates — but no single value is claimed to be optimal.
- The rotation cost is measured on an older cost basis. The direction is settled and is already reflected in the published figures; the exact size of the credit-axis cost has not been re-derived since the commission basis moved to $1.20. That is why this lesson describes it rather than quoting a number for it.
- Execution risk is real and is not in the numbers. A missed defend step, a stop left unplaced, a wrong strike — the model does none of these things and you eventually will. That gap is yours, and it is the strongest argument for paper trading the loop first.
Putting It Together
- The defend rule was reasoned before it was tested, not explained afterward
- Every exit is modeled at a price you could actually have traded; entries are modeled at the midpoint, and that is stated rather than buried
- The benchmark is a real mechanical MEIC, not zero — and the separation is risk, not return
- Costs are modeled all-in at $1.20 per contract per event, with worse rates published beside it
- Validation requires holding up across separate sub-periods, not one good stretch
- Rotation costs something on the credit axis, and that cost is already in the figures
- The published results assume the policy this course teaches — including re-pegging
The Direction Rule
This is the single most important concept in the entire course. Every other decision — strikes, spreads, sizing — flows from this. Get it automatic before your first live trade.
The Core Concept
Phoenix and Lynx signals tell you which direction the market is expected to move. As an options trader, your job is to sell premium on the side the market is moving away from. You're not betting the market will reach your strike — you're betting it will stay away from it.
This means:
- You never buy options on Phoenix or Lynx signals — you sell credit spreads
- Direction determines which type of spread you sell — puts or calls
- The spread profits when the market moves in the signal's direction — or even when it just stays still
- You collect a credit up front and keep it if the spread expires worthless
The Rule — Two Sentences
Sell a put below current SPX price. Buy a lower-strike put further OTM as your hedge.
The market moving UP moves you further away from your short strike. The spread decays toward zero and you keep the credit.
Sell a call above current SPX price. Buy a higher-strike call further OTM as your hedge.
The market moving DOWN moves you further away from your short strike. The spread decays toward zero and you keep the credit.
Why You Sell OTM — Not ATM
Your short strike needs to be far enough OTM that the market is unlikely to reach it within the trade window — even on a losing futures trade. The target zone is 15–20 delta, approximately 20–30 SPX points OTM.
Not enough premium to be worthwhile. Risk/reward doesn't make sense at this width and delta combination.
Marginal. Not enough premium for the Trailing Profit Lock to produce a meaningful profit after the trail activates.
Enough premium for the Trailing Profit Lock to work effectively. Enough distance OTM to survive adverse moves on losing futures trades.
The NQ/ES to SPX Connection
Phoenix and Lynx both trade NQ futures. You're trading SPX options. Why does a NQ signal apply to SPX?
NQ (Nasdaq 100 futures) and SPX (S&P 500) move in the same direction 93% of the time on 5-minute bars — measured across over 119,000 data points spanning six years. When a NQ signal fires, there's a 93% chance SPX is moving the same direction at the same time.
| You Follow | You Trade | Correlation | Notes |
|---|---|---|---|
| #alerts-phoenix-nq-trades | SPX 0DTE spreads | 93% | Both Phoenix and Lynx NQ signals appear in this channel. High correlation with SPX, clean signal stream. |
| #alerts-phoenix-es-trades | SPX 0DTE spreads | ~99% | ES is the S&P 500 futures contract — near-perfect correlation with SPX. Some traders prefer ES signals for SPX trades. |
| #alerts-phoenix-nq-trades | SPY options | 93% | SPY moves with SPX at ~1/10th the price. Same directional logic applies. SPY is better for smaller accounts. |
IRA Accounts
Phoenix and Lynx signals work perfectly in IRA accounts. This is one of the most underappreciated advantages of the service — vertical credit spreads are defined-risk and available at most IRA-friendly brokers.
- No futures account needed — you're trading SPX options at your stock broker
- Defined risk — max loss is the spread width, known at entry
- No margin beyond spread width required — a $25 wide SPX spread requires $2,500 in buying power per contract, minus the credit received
- All intraday — zero overnight risk in your retirement account
- 0DTE options available at all major IRA-friendly brokers including ThinkorSwim (Schwab) and tastytrade
The Most Common Direction Mistakes
Structuring the Spread
The direction rule tells you which side to trade. This lesson covers the three parameters that define every spread — delta, width, and target credit — and how to find the sweet spot quickly when an entry alert fires.
The Three Parameters
Every SPX vertical credit spread is defined by three things. Get these right and the math works in your favor. Get them wrong and even a winning signal can produce a losing trade.
The delta of your short strike. Controls how far OTM you are and how much premium you collect.
The distance between your short and long strikes in SPX points. Controls max risk and net credit.
The net credit collected for the spread. This is your maximum profit and the baseline for all Trailing Profit Lock calculations.
Why Width Matters More Than You Think
New subscribers are often surprised that a $5-wide spread collects so little at 15–20 delta. Here’s why width is the key lever:
At 15–20 delta, the short strike is worth roughly $2.50–$3.50 in premium. The long strike — the one that caps your risk — costs almost as much as the short strike if it’s only $5 away. The net credit after buying the hedge is tiny.
When you widen to $20–$25, the long strike moves much further OTM where it costs almost nothing. Now almost all of the short strike premium flows through as net credit. Width is what unlocks the premium.
| Spread | Width | Delta | Approx Credit | Max Risk/ct | Verdict |
|---|---|---|---|---|---|
| 5,600/5,605 call | $5 | ~18Δ | ~$0.40–$0.60 | $500 | Too little premium |
| 5,600/5,610 call | $10 | ~18Δ | ~$1.20–$1.40 | $1,000 | Marginal |
| 5,600/5,620 call | $20 | ~18Δ | ~$2.00–$2.20 | $2,000 | Good |
| 5,600/5,625 call | $25 | ~18Δ | ~$2.35–$2.60 | $2,500 | Sweet spot |
Credits are approximate. Actual fills vary $0.05–$0.15 depending on bid/ask spread and time of day.
Understanding the Risk/Reward
At first glance, risking $2,260 to make variable profit on a $25-wide spread looks complex. Two critical factors make the math work strongly in your favor.
The validated options win rate is ~70% — confirmed against 1,687 real SPX spread simulations using actual options bid/ask prices from May 2022 through May 2026.
The exit mechanism is the Trailing Profit Lock. The spread must first decay to 62% of the original credit — your threshold. Once hit, instead of closing immediately, a trailing stop activates. The profit floor ratchets up as the spread keeps decaying. The position closes when the spread reverses by more than 26% of the peak profit achieved.
Example on $2.00 credit: threshold hit at $1.24 spread value (profit = $76). Spread keeps decaying to $0.40 (profit = $160, floor = $118). Bounces to $0.66 (profit = $134, below floor) → exit at $134 profit.
Two mechanisms limit loss on every trade:
Stop loss at 3.5× credit. If the spread expands to 3.5× the original credit ($7.00 on a $2.00 entry), the position closes automatically. This is the worst-case exit — rare but defined.
Futures sync rule. If the Phoenix or Lynx futures trade hits its stop loss mid-session, the options position closes immediately at current market value — typically well before the 3.5× stop triggers. This is the most common loss scenario and produces smaller losses than the formal stop.
Of the losing trades in our backtested dataset, the majority closed via the futures sync rule at an average loss well below the theoretical maximum.
Average winner (net): ~$80/contract — trail captures meaningful decay past the threshold
Average loser (net): ~$141/contract — weighted mix of stop loss hits and EOD closes
70 wins × $80 = +$5,600
30 losses × $141 = −$4,230
Net: +$1,370 per 100 trades on 1 contract (before commissions)
This is validated against 1,687 individual spread simulations across multiple parameter combinations. The edge is real and statistically confirmed.
What the Trade Data Actually Shows
We analyzed 1,687 Phoenix and Lynx NQ signals with real SPX options data (May 2022 – May 2026) using actual bid/ask prices. Here is the C1 exit breakdown:
| Exit Type | Count | % of Trades | Avg Result | Options Result |
|---|---|---|---|---|
| Trailing stop fires | 845 | 50.1% | +$67 | Win — trail captured decay past threshold |
| Expires worthless | 99 | 5.9% | +$200 | Maximum win — full credit retained |
| Expires with value | 91 | 5.4% | +$155 | Win — significant decay captured |
| EOD without threshold hit | 612 | 36.3% | −$71 | Small loss or flat — spread never decayed to 62% threshold; closed at end of session |
| Stop loss (3.5× credit) | 40 | 2.4% | −$574 | Larger loss — spread expanded sharply before recovery |
The Options Edge on Losing Futures Trades
One of the most important characteristics of this approach: even when the futures trade loses, the options spread often has a favorable excursion before the stop fires. The Trailing Profit Lock threshold was already active on many of these trades, locking in partial profit before the futures stop closed the position.
| Options Threshold | Example on $2.00 Credit | % of Futures Losers That Touched It |
|---|---|---|
| 62% threshold (trail activates) | Spread decays to $1.24 → trail locks in floor | ~70% |
| 75% decayed | Spread decays to $0.50 | ~55% |
| Full decay | Spread expires worthless | ~25% |
Adjusting for Time of Day
Implied volatility and therefore premium levels change throughout the trading session. Morning signals are the easiest to structure — afternoon signals require slight adjustments.
| Time of Day | IV Environment | Typical Premium | Adjustment |
|---|---|---|---|
| 9:30–11:00 AM ET | High IV — opening volatility | Easiest to hit $2.00+ | None needed — standard structure works well |
| 11:00 AM–1:00 PM ET | Moderate IV — midday | $2.00 achievable at 15–20Δ | May need to go slightly wider or slightly closer to ATM |
| 1:00–2:00 PM ET | Lower IV — theta has decayed | May need to adjust | Consider going to 20–22Δ or widening to $30 to collect $1.95+. Accept $1.75+ if $2.00 isn’t achievable — don’t go closer than 15Δ to compensate. |
| After 2:00 PM ET | Very low IV — late session | Premium severely compressed | Do not enter. No new spread positions after 2:00 PM ET regardless of credit available. Skip the signal entirely. |
A Complete Spread Example
A signal fires. SPX is at 5,572. Here’s how to structure the spread step by step.
Minimum Credit — When to Pass
Not every signal will produce a spread worth trading. If you can’t collect at least $1.50 on a $20-wide spread at 15–20 delta, the signal may not be worth trading with options that session.
- $1.95–$2.00+ on a $20–$25 wide spread — ideal
- $1.75+ — acceptable, slightly less room for the trail to work
- $1.50+ — minimum threshold, consider sizing down
- Less than $1.50 on a $20-wide spread
- Can’t find $1.50+ without going closer than 15Δ
- Signal fires after 2:00 PM ET — skip entirely
The Phoenix Spreadsheet Makes This Faster
The Phoenix Spreadsheet pulls live SPX option chain data from ThinkorSwim and displays a color-coded matrix of delta × width combinations — showing net credits for every combination at a glance. Green cells meet the $2.00 threshold. Yellow cells are marginal. No math required.
When a signal fires:
- Click LONG or SHORT — the correct spread side highlights automatically
- Find a green cell in the $20–$25 wide row at 15–20 delta
- Click the cell — the order details populate automatically including threshold price and stop loss level
- Copy the order block and paste directly into ThinkorSwim
The full Phoenix Spreadsheet guide is in Module 5. If you haven’t downloaded and registered it yet, do that before your first live trade — it significantly reduces execution time when an entry alert fires.
Strike Selection
You have the direction and you know the target structure. This lesson covers how to find the right strikes quickly — from opening the chain to confirming your spread — in the minutes between the Setup Forming and Entry alerts.
Speed Is the Constraint
Strike selection happens under time pressure. From the moment the Entry alert fires, you have seconds to identify your strikes, structure the spread, and get your opening order in. The Setup Forming alert gives you 5–25 minutes to prepare — use that time to get your chain open and your candidate strikes identified before the entry confirms.
Step-by-Step Strike Selection
Open the 0DTE SPX options chain.
In ThinkorSwim: Trade tab → type SPX → select today's expiration (the one that says 0 days to expiration). Make sure you're on the correct expiration — not tomorrow's or this week's.
Go to the correct side based on signal direction.
LONG signal → puts side. SHORT signal → calls side. The Phoenix Spreadsheet highlights this automatically when you click LONG or SHORT.
Find your short strike — target 15–20 delta, approximately 20–30 SPX points OTM.
Look at the delta column. Find a strike where delta is between 0.15 and 0.20. This will typically be 20–30 points away from current SPX price depending on IV. Check the mark price — you want the short strike mark around $2.50–$3.50.
Select your long strike — widen until net credit is approximately $1.95–$2.00.
Move 20–25 points further OTM from your short strike. Check the net credit. You want $1.95+ minimum. The long strike at this distance costs very little — the credit is mostly the short leg premium flowing through.
Confirm credit and max risk before entering.
Net credit must be at least $1.50. Max risk = width × $100 per contract. A $25 wide spread = $2,500 max risk per contract. Know your numbers before you place the order.
Enter when the Entry alert confirms.
Sell the vertical at mid or market. SPX 0DTE bid/ask is typically $0.05–$0.15 wide — you can usually get mid or close to it. Get filled, then immediately place your stop loss at 3.5× the credit received.
A Live Example — SHORT Signal
A signal fires at 1:15 PM ET. SPX is at 5,572. Here's the strike selection process in real time.
Reading the Delta Column
Delta is your primary guide for strike distance. Here's how to interpret what you're seeing in the chain:
| Delta Range | What It Means | For These Spreads |
|---|---|---|
| > 30Δ | Too close to ATM. High premium but significant risk of being tested on any adverse move. | Avoid — too close to current price |
| 20–30Δ | Slightly aggressive. Good premium but less buffer. Acceptable if IV is low and you can't hit $1.95 at lower delta. | Use only if needed to hit credit target |
| 15–20Δ | Sweet spot. Enough premium at $20–$25 wide to collect ~$2.00. Enough distance to survive adverse moves on losing futures trades. | Target zone — aim here first |
| 10–15Δ | Very far OTM. Safe but premium is too thin even at $25 wide. Net credit unlikely to reach $1.50. | Too far OTM — insufficient premium |
Common Strike Selection Scenarios
Real-world conditions don't always cooperate. Here's how to handle the most common situations:
Scenario 1 — IV Is High, Lots of Premium
High-volatility days (VIX above 20) push strikes further OTM at the same delta — you can collect $2.00+ at 15Δ with a $20-wide spread. Don't go wider than $25 just because more premium is available. Stick with the standard structure and enjoy the better credit.
Scenario 2 — IV Is Low, Premium Is Thin
Quiet days (VIX below 14) compress premium. A 15–20Δ strike on a $20-wide spread may only collect $1.50–$1.75. Options:
- Accept $1.75 and proceed — still workable
- Widen to $25–$30 to collect ~$2.00
- Go slightly closer to ATM — 20–22Δ — but don't go above 25Δ
- If you can't collect $1.50 on a $20-wide spread, consider skipping the signal for options
Scenario 3 — Afternoon Signal
No new spread entries after 2:00 PM ET. If the signal fires at 2:05 PM, skip it entirely — don't enter. Signals between 1:00 and 2:00 PM will have lower premium due to theta decay; go slightly closer to ATM or widen to $30 if needed to collect $1.95+.
Scenario 4 — Strike Prices Don't Land Where You Want
SPX options trade in $5 increments. Your ideal short strike based on delta may fall between two available strikes. Always go to the strike further OTM — the one with the lower delta. Never compromise strike distance to get a round number.
Using the Phoenix Spreadsheet for Strike Selection
The Phoenix Spreadsheet eliminates manual chain scanning. It pulls live data from ThinkorSwim and displays every delta × width combination in a color-coded matrix — net credits updated in real time.
- Open TOS chain manually
- Find the correct expiration
- Navigate to puts or calls
- Scan delta column to find 15–20Δ
- Calculate net credits for different widths
- Decide on strikes
- Build the spread order manually
Total time: 2–4 minutes under pressure
- Click LONG or SHORT
- Find a green cell at 15–20Δ, $20–$25 wide
- Click the cell
- Copy order → paste into TOS
Total time: 20–30 seconds
Strike Selection Quick Reference
| Parameter | Target | Minimum | Never Go Beyond |
|---|---|---|---|
| Short strike delta | 15–20Δ | 15Δ | 25Δ (too close to ATM) |
| Spread width | $20–$25 | $20 | $30 (max risk too high for small accounts) |
| Net credit | $1.95–$2.00+ | $1.50 | No upper limit — more credit is always better |
| Distance OTM | 20–30 SPX pts | 15 pts | Don't go further than needed to hit credit target |
| Signal entry cutoff | Before 2:00 PM ET | — | No new entries after 2:00 PM ET — skip the signal |
The Trailing Profit Lock
The exit mechanism that captures more profit on winning trades without adding risk at entry. This lesson explains how it works, why it replaced the fixed profit target, and how to implement it at every level from fully manual to fully automated.
The Core Concept — Two Phases
Every Phoenix options trade has two distinct phases. Understanding this separation is the key to understanding the Trailing Profit Lock.
The spread is open. The stop loss protects against catastrophic moves. The position rides, waiting for the spread to decay to the threshold.
Nothing to manage. Stop loss is active at 3.5× credit. Walk away.
The spread has decayed to the threshold. The trailing stop activates. The profit floor ratchets upward as the spread keeps decaying. A reversal of 26% from peak profit triggers the exit.
Floor protects your profit. Spread can keep running.
A Step-by-Step Walkthrough
A signal fires. You sell 1 SPX spread at $2.00 credit. Here is the Trailing Profit Lock in action on a strong decay day.
Now the same trade on a reversal day — the spread hits the threshold but bounces back quickly.
Why This Replaced the 30-Minute Rule
The original course used a 30-minute fixed time stop as the primary exit mechanism. The Trailing Profit Lock replaced it for two distinct reasons, each confirmed independently by the research.
Reason 1 — Time Stops Leave Money on the Table
Across every parameter combination tested, rides to end-of-day outperformed any fixed time stop. When a signal has a genuine directional edge, theta decay continues working in your favor all session. Cutting the trade off at 30 minutes captures a fraction of the available profit on winning trades.
The original reasoning behind the 30-minute rule was sound: winning trades tend to resolve quickly. The data confirms this — most winning trades do hit the profit threshold within 30–60 minutes. But the exit mechanism does not need to be a clock. The Trailing Profit Lock exits when the spread stops decaying and starts reversing — a price-based signal that is more precise than a timer.
Reason 2 — The Fixed Target Exits Too Early on Strong Days
On a strong directional day, a spread sold for $2.00 may decay to $0.10 or even expire worthless. A fixed 62% target exits at $1.24 and misses $1.14 of additional credit. The Trailing Profit Lock rides through continued decay and exits only when the reversal is meaningful — capturing a far larger share of the available move on strong days.
| Exit Method | Net 4yr (2-lot) | Max DD | P/DD | Sharpe |
|---|---|---|---|---|
| Fixed PT + 30-min time stop | $23,693 | $5,876 | 4.0× | 1.22 |
| Fixed PT + ride to end of day | $47,035 | $4,272 | 11.0× | 1.94 |
| Trailing Profit Lock (62%, 26% trail) ? | $52,619 | $4,132 | 12.7× | 2.15 |
Competition mode (Phoenix + Lynx), 2-lot spread, SL=3.5×, C2 breakeven=$0.10, no overlap, PM cutoff 14:00 ET. Net of commissions at $1.09/contract.
Why There Is No Price Stop
New subscribers sometimes want to add a price stop — closing the spread if it expands to 2× the credit collected. The data says don't, for the same reason the original course documented.
Phoenix and Lynx are mean-reversion strategies. The futures trade frequently oscillates against you before recovering. A price stop at 2× credit fires during these oscillations and converts eventual winners into losers. The stop loss at 3.5× credit exists to handle genuine catastrophic moves — not normal intraday noise.
The MFE Foundation — Why Spreads Keep Decaying
Maximum Favorable Excursion analysis of 1,687 Phoenix and Lynx signals confirms the underlying dynamic that makes the Trailing Profit Lock effective: most signals generate a directional move significant enough to decay the spread well past any fixed threshold.
Implementation — Three Paths
The Trailing Profit Lock can be implemented at three levels depending on your broker capabilities and preference for automation. All three are valid. Choose the one that matches your workflow.
Best for: Subscribers using TAT (Trade Automation Toolbox) or Options Alpha.
Automation handles the conditional trigger cleanly. When the spread decays to the threshold price, the platform detects it, cancels the stop loss, and activates a trailing stop — all without manual intervention.
Effort after entry: Zero. Fully hands-off.
Best for: Active traders comfortable monitoring positions.
- Enter spread, place stop loss at 3.5× credit
- Monitor the position
- When spread reaches threshold ($1.24 on $2.00 credit), cancel stop loss and place a trailing stop order in dollar terms
- Broker’s trailing stop ratchets automatically from there
Note: Trail amount in dollars approximates the 26% trail. On a $2.00 credit trade at threshold (profit = $0.76), trail = ~$0.20/share (round up to nearest $0.05). Update as the trade progresses if needed.
Best for: Manual traders who prefer set-and-forget simplicity.
Place a GTC limit order at the threshold price ($1.24 on a $2.00 credit). When the spread decays to this level, the position closes automatically. No monitoring required.
You give up the additional decay past the threshold but maintain a fully automated, hands-off exit.
Effort after entry: Zero. Same as the original workflow — just a different price.
Threshold and Trail Parameters
The research tested every combination of threshold and trail stop percentage exhaustively across 1,687 simulated trades using real SPX options bid/ask prices.
Threshold — Where the Trail Activates
The threshold was tested from 56% through 65% of credit remaining. The results peak clearly at 62%.
| Threshold | Spread Value at Trigger ($2.00 credit) | Profit at Trigger | Best P/DD (2-lot) |
|---|---|---|---|
| 56% | $1.12 | $88 | 10.9× |
| 58% | $1.16 | $84 | 11.3× |
| 60% | $1.20 | $80 | 11.9× |
| 62% ? | $1.24 | $76 | 12.7× |
| 63% | $1.26 | $74 | 12.3× |
| 64% | $1.28 | $72 | 11.0× |
| 65% | $1.30 | $70 | 9.9× |
Trail Stop — How Much to Give Back
The trail stop percentage was tested from 22% through 30%. The result was a remarkably flat plateau — less than 0.2x difference in P/DD across the entire range. The peak sits at 26% but any value from 22–30% is defensible.
| Trail Stop % | Profit Floor | Net 4yr (2-lot) | P/DD | Verdict |
|---|---|---|---|---|
| 22% | 78% of peak | $51,072 | 12.5× | Good |
| 23% | 77% of peak | $51,584 | 12.7× | Good |
| 24% | 76% of peak | $51,412 | 12.5× | Good |
| 25% | 75% of peak | $52,029 | 12.6× | Good |
| 26% ? | 74% of peak | $52,619 | 12.7× | Recommended |
| 28% | 72% of peak | $52,365 | 12.6× | Good |
| 30% | 70% of peak | $52,481 | 12.7× | Good |
Common Mistakes to Avoid
Position Sizing
The edge plays out over dozens of trades — not any single signal. Position sizing is what keeps you in the game long enough for the math to work in your favor.
The Core Principle
Position sizing for these spreads has one goal: make sure no single losing trade — or even a string of losing trades — forces you to stop trading before the edge has time to play out.
At a 70.4% validated win rate, you'll have roughly 3 losing trades per 10 signals. Those losses are expected and accounted for in the strategy's edge. The only way they become a problem is if you size so large that a bad week materially damages your account or your confidence.
Starting Out — Always 1 Spread
Regardless of account size, start with 1 spread for your first 10–15 trades. This isn't about being conservative — it's about learning the workflow cleanly before adding size.
Your first priority is executing the full sequence correctly every time:
- Reading the direction right under time pressure
- Finding strikes and structuring the spread quickly
- Placing the stop loss immediately after fill
- Monitoring for the threshold and converting to the trail (or letting the fixed GTC limit handle it)
- Verifying flat after the position closes
- Not second-guessing or overriding the trail mid-trade
Get those steps automatic at 1 spread before you think about scaling. A fumbled execution at 5 spreads costs 5× more than a fumbled execution at 1.
Understanding Your Real Loss Exposure
Sizing correctly requires understanding what a realistic loss actually looks like — not just the theoretical maximum. The research identified two distinct loss scenarios with very different average outcomes.
| Loss Type | Trigger | Frequency | Avg Loss / Spread |
|---|---|---|---|
| EOD without threshold hit | Spread never decayed to 62% threshold — closed at end of session | ~27% of all trades | ~$71 avg (small loss or near flat) |
| Formal stop loss | Spread expands to 3.5× credit before recovery | ~2.4% of all trades | ~$574 avg |
| Weighted average loss | Blended across all losing trades | ~29.6% of all trades | ~$141 |
Sizing by Account Size
Once you're comfortable with the workflow, here's a general framework for scaling. These are starting points — adjust based on your personal risk tolerance and account rules.
| Account Size | Configuration | Typical Loss / Trade | Notes |
|---|---|---|---|
| $15,000–$25,000 | 1-lot spread (starter) | ~$141 typical / ~$574 stop | 1 spread until 20+ clean executions. Scale to 2-lot when account and workflow support it. |
| $25,000–$50,000 | 2-lot spread (recommended) | ~$282 typical / ~$1,148 stop | Sweet spot. Enables the full scale-out. Peak margin ~$5,573. Comfortable at $25,000+. |
| $50,000–$100,000 | 2–4 lot spreads | Scales proportionally | Run multiple 2-lot positions rather than larger single positions. Keep max daily loss under 3% of account. |
| $100,000+ | 4+ lot spreads | Scales proportionally | SPX 0DTE is the most liquid options market in the world. Fills remain clean at larger sizes. |
Peak margin based on $25-wide SPX spread. Typical loss figures are weighted averages from the 1,687-trade backtested dataset.
The 5% Rule
A simple sizing guardrail: never risk more than 5% of your account on a single trade. For most traders this means:
Thinking About Daily Loss Limits
Phoenix and Lynx together average roughly 2–3 signals per day. On a bad day you could have 2 losing trades in a row. Here is the realistic worst-case by spread size:
Make sure your account can absorb the worst-case day at your chosen spread size without materially impacting your ability to continue trading. If a bad day at your current size would cause you to stop trading or significantly reduce size, you're too large.
Scaling Up — When and How
Adding size is straightforward once you're ready. Here's a disciplined approach:
Complete 15–20 trades at current size cleanly. Every execution correct — direction right, stop loss placed immediately, threshold monitored (or fixed GTC in place), no overrides. If you fumbled any, those don't count.
Confirm your account has grown enough to support the next size level. Don't scale up after a losing period — let the edge play out and scale when the account has recovered and grown.
Move from 1-lot to 2-lot before adding more size. The jump to 2-lot unlocks the scale-out mechanic and more than doubles your long-run return. Master the C2 breakeven stop management before going larger.
Beyond 2-lot, scale by running additional 2-lot positions. Two separate 2-lot positions is better than one 4-lot position — you get two independent scale-out opportunities and cleaner risk management.
Never scale based on a winning streak. Size based on account balance and the 5% rule — not on how the last 5 trades went.
Using SPY to Practice
If you want to get reps with the workflow before risking meaningful capital, SPY spreads are a useful alternative. SPY trades at roughly 1/10th of SPX — a $2–$3 wide SPY spread has similar characteristics to a $20–$25 wide SPX spread but with much lower dollar exposure.
| Instrument | Typical Width | Typical Credit | Max Risk / Spread | Best For |
|---|---|---|---|---|
| SPX | $20–$25 | ~$2.00 | ~$2,300 | Standard trading — best liquidity |
| SPY | $2–$3 | ~$0.20 | ~$230 | Learning the workflow, very small accounts |
Position Sizing — Quick Reference
| Rule | Guideline |
|---|---|
| Starting size | 1-lot spread — regardless of account size — for first 15–20 trades |
| Max risk per trade | 5% of account maximum (based on 3.5× stop loss as max risk) |
| Scaling trigger | 15–20 clean executions at current size + account has grown to support next level |
| Scaling path | 1-lot → 2-lot → multiple 2-lot positions. Never skip the 2-lot stage. |
| Minimum account — 1-lot | $15,000 (covers margin with buffer) |
| Minimum account — 2-lot | $25,000 (covers ~$5,573 peak margin with buffer) |
| Typical loss / spread | ~$141 weighted average (EOD without PT: ~$71, formal stop: ~$574) |
| Max consecutive losses | 6 (recorded in 1,687-trade backtested dataset) |
| Never scale based on | Recent winning streak, gut feeling, or “I’ve been doing well lately” |
| Scale down when | Drawdown is affecting discipline — overriding trail, second-guessing entries |
Entry Order Structure in ThinkorSwim
The complete order sequence for every trade — from opening the spread to placing your exit orders — for each of the three implementation paths covered in Lesson 4.
The Two Exit Orders
Every trade requires exactly two exit orders placed immediately after the opening spread fills. These two orders protect the position from both directions — one captures profit, one limits loss.
Trailing Stop or Fixed Limit
Captures profit when the spread decays favorably. Mechanism depends on which implementation path you are using.
Stop Loss at 3.5× Credit
Closes the position if the spread expands to 3.5× the original credit. Present on all paths. Always placed immediately after fill.
Choose Your Implementation Path
The order structure varies depending on which implementation path you selected in Lesson 4. Review your path before proceeding.
| Path | Method | Monitoring Required | Order Complexity |
|---|---|---|---|
| Path A | Automation (TAT / Options Alpha) | None | Low — platform manages trail |
| Path B | Manual trailing stop | Required — must act at threshold | Medium — two-stage management |
| Path C | Fixed GTC limit at threshold | None | Low — fully set-and-forget |
Path C — Fixed GTC Limit (Set and Forget)
Path C is the simplest order structure and requires no monitoring after entry. Place a GTC limit at the threshold price and a stop loss at 3.5× credit as an OCO pair. Whichever fires first cancels the other.
Step 1 — Open the Options Chain and Build the Spread
Go to the Trade tab in ThinkorSwim. Type SPX and select today’s expiration (0DTE). Confirm the date — not tomorrow’s, not this week’s.
Navigate to puts (LONG signal) or calls (SHORT signal). Find your short strike at 15–20 delta, widen to ~$2.00 credit. Right-click → Sell → Vertical.
Set Advanced Order → 1st Triggers OCO. This tells TOS the opening order fires first, then arms both closing orders as an OCO pair automatically.
Verify: correct strikes, correct direction (Sell to Open), correct quantity, net credit shown is acceptable (≥$1.50).
Step 2 — Add the Two Closing Orders (OCO Pair)
GTC Profit Limit — Buy to Close at threshold price
Order type: Limit. Action: Buy to Close. Price: credit × 0.62 (the spread value at the 62% threshold). Time in force: GTC.
Example: collected $2.00 → limit at $1.24 (close when spread has decayed to 62% of credit, locking in $76 profit per contract).
Stop Loss — Buy to Close at 3.5× credit
Order type: Stop (Mark). Action: Buy to Close. Trigger price: credit × 3.5.
Example: collected $2.00 → stop trigger at $7.00. If the spread expands to $7.00, position closes at market.
Path B — Manual Trailing Stop
Path B captures more profit than Path C on strong decay days but requires you to monitor the position and act when the threshold is reached. Do not attempt Path B if you cannot reliably watch the position.
At Entry
Open and fill the spread as normal. Do not use 1st Triggers OCO for Path B — place the stop loss as a standalone order after fill.
Immediately place a Stop Loss: Buy to Close at 3.5× credit (e.g. $7.00 on $2.00 credit). This is your protection during Phase 1.
When the Threshold Is Reached
Spread decays to the threshold price (e.g. $1.24 on $2.00 credit). Cancel the stop loss order immediately.
Place a Trailing Stop: Buy to Close with trail amount in dollars. Calculate the trail as approximately 26% of the current profit. At the $1.24 threshold on a $2.00 credit, profit = $0.76 → trail = $0.76 × 0.26 = ~$0.20/share (rounded up to nearest $0.05).
The broker’s trailing stop ratchets automatically from that point. Walk away — the trail will fire when the spread reverses by more than $0.20 from its lowest point.
Path A — Automation (TAT / Options Alpha)
Automation handles the conditional threshold detection and trail activation without any manual intervention. This is the recommended approach for subscribers trading 2-lot spreads.
The specific configuration steps vary by platform — see the TAT and Options Alpha guides in Module 5 for platform-specific instructions. The logical rules are the same for both:
On fill: place stop loss at 3.5× credit.
When spread reaches threshold (62% of credit): cancel stop loss, activate trailing stop at 26% of current profit.
When C1 trail fires: activate C2 breakeven stop at original credit minus $0.10 (if before 2:00 PM ET).
C2 rides: breakeven stop closes if spread reverses above original credit. Otherwise expires or decays further.
Quick Reference — Exit Order Calculations
For any credit amount, here are the two key order prices to calculate immediately after fill:
| Credit Collected | Threshold Price (62%) | Stop Loss (3.5×) | Trail Amount (~26% of threshold profit) |
|---|---|---|---|
| $1.50 | $0.93 | $5.25 | ~$0.15 |
| $1.75 | $1.09 | $6.13 | ~$0.17 |
| $2.00 | $1.24 | $7.00 | ~$0.20 |
| $2.25 | $1.40 | $7.88 | ~$0.22 |
| $2.50 | $1.55 | $8.75 | ~$0.25 |
| $2.75 | $1.71 | $9.63 | ~$0.27 |
Threshold = credit × 0.62. Stop loss = credit × 3.5. Trail amount = (credit − threshold) × 0.26. Round trail up to nearest $0.05 for broker entry.
The PDT Rule and Close as Box
If your account is flagged as a Pattern Day Trader (PDT) and you have less than $25,000 in margin equity, you’re limited to 3 day trades per rolling 5-day period. Each trade — opening and closing a spread on the same day — counts as one day trade.
The Phoenix Spreadsheet includes a Close as Box option that solves this. When checked, the closing legs use the opposite option type — creating a box spread that locks in P&L without counting as a day trade round-trip.
- Your account is flagged PDT
- You have less than $25,000 in margin equity
- You’ve already used 2 of your 3 allowed day trades this week
- Your account is not PDT-restricted
- You have over $25,000 in margin equity
- You’re in an IRA — PDT rules don’t apply to IRAs
Order Entry Mistakes to Avoid
Scale-Out Strategies
The Trailing Profit Lock exit gives Contract 1 more profit per winner. The scale-out strategy adds Contract 2 as a free rider — a zero-risk position that collects additional credit after C1 exits profitably. Together these two mechanisms are responsible for the majority of the strategy’s long-term profitability.
The Core Idea
Every trade has a binary outcome for the scale-out: either C1 exits profitably via the Trailing Profit Lock, or the trade loses and all contracts close simultaneously. The scale-out only activates in the winning scenario — it adds upside on winners without adding risk at entry.
The Trailing Profit Lock fires. C1 closes with a profit. Immediately, C2 converts to a breakeven stop — its stop is moved to the original credit collected. C2 rides toward expiration at zero risk.
The worst case from this point: breakeven stop fires, you keep the C1 profit. The best case: C2 expires worthless, collecting full additional credit.
Either the spread never decayed to the threshold and closed at EOD, or the stop loss fired on the full position. All contracts — C1 and C2 — close at the same time for the same loss.
No scale-out occurs. The additional contracts add proportional loss exposure on losing trades. This is why sizing correctly matters — see Lesson 5.
The PM Cutoff Rule
C2 only activates when C1 exits profitably before 2:00 PM ET. Signals that fire late in the session may not leave enough time for meaningful theta decay on C2 after C1 exits.
| Signal Entry Time | C1 Trail/Exit | C2 Scale-Out |
|---|---|---|
| Before 2:00 PM ET | Normal — trail fires when ready | Activates when C1 exits profitably |
| After 2:00 PM ET | Do not enter — skip signal entirely | N/A — no entry after 2:00 PM ET |
What Happens to C2
Once C1 exits profitably and the C2 breakeven stop is activated, three outcomes are possible. All three are profitable or flat — there is no losing scenario for C2 once the breakeven stop is in place.
Expires Worthless
The spread decays to near zero by market close. Full original credit collected as additional profit. Zero commission to close.
Expires with Value
The spread decays significantly but not to zero. Partial profit collected — approximately $139 average on a $2.05 avg credit.
Breakeven Stop Fires
The spread reverses back to the breakeven level. C2 closes at approximately the original credit — roughly flat. C1 profit is unaffected.
1-Lot vs 2-Lot — Performance Comparison
All figures based on PT=62%, trail=26%, SL=3.5×, C2 breakeven lock=$0.10, no overlap, PM cutoff 14:00 ET. May 2022 – May 2026. Commissions $1.09/contract all-in.
| Metric | 1-Lot Spread | 2-Lot Spread |
|---|---|---|
| Net profit (4yr) | ~$21,700 | $52,619 |
| Monthly average | ~$450 | ~$1,096 |
| Max drawdown | ~$2,700 | $4,132 |
| P/DD ratio | 7.9× | 12.7× |
| Sharpe ratio | 1.57 | 2.15 |
| K-Ratio | 2.74 | 3.47 |
| Win rate | 70.4% | 70.4% |
| CAGR | ~36% | ~53% |
| Min account | $15,000 | $25,000 |
| Peak margin | ~$2,800 | ~$5,573 |
| Scale-out eligible | No | Yes — C2 rides at zero risk |
Expected Value of C2
On every signal where C1 exits profitably before 2:00 PM ET (49.8% of all signals), C2 generates additional expected value. Here is the math on a $2.05 average credit:
Step-by-Step — The 2-Lot Scale-Out Sequence
At Entry
Sell a 2-lot vertical spread (buy 2 / sell 2). Place stop loss at 3.5× credit covering both lots.
For Path C: place GTC limit at threshold price on 1 lot only.
For Path B: place stop loss on 2 lots, monitor for threshold on 1 lot.
For Path A: configure platform rules for C1 exit and C2 activation.
When C1 Exits Profitably
C1 closes. Immediately place a GTC limit on C2: Buy to Close at original credit minus $0.10 (the breakeven lock). Example: sold at $2.00 → C2 stop at $1.90.
Cancel the original stop loss that covered both lots. C2 is now protected by the breakeven stop only — zero downside risk beyond flat.
Walk away. C2 rides toward expiration. The breakeven stop closes it if the spread reverses; otherwise it expires or decays further.
If C1 Does Not Exit Profitably
If C1 is closed by the stop loss or goes to EOD without hitting the threshold, all contracts close simultaneously. No scale-out occurs. This is the correct outcome — the scale-out only activates when the trade is validated by C1 exiting at profit.
Common Scale-Out Mistakes
Automation (TAT / Options Alpha)
The Trailing Profit Lock is significantly more powerful with automation. This lesson explains why, covers the two platforms being integrated with Phoenix and Lynx, and documents the current status of that integration.
Why Automation Matters for This Strategy
The Trailing Profit Lock introduces a conditional step that is difficult to automate manually: when the spread reaches the 62% threshold, cancel the stop loss and activate the trailing stop. This conversion requires either active monitoring (Path B) or accepting the fixed PT alternative (Path C).
Automation removes this constraint entirely. A rule-based platform monitors spread prices in real time and fires the conversion the moment the threshold is reached — regardless of whether you are watching. This unlocks the full Trailing Profit Lock performance and makes 2-lot management seamless.
- Path C (fixed PT at threshold) or Path B (manual monitor)
- Must watch for threshold conversion on Path B
- 2-lot C2 management requires attention after C1 exits
- Miss the threshold on Path B → no trail protection
- Multiple simultaneous signals require split attention
- Full Trailing Profit Lock — Path A
- Threshold conversion fires automatically the moment price is reached
- C2 breakeven stop activates the instant C1 exits
- 2-lot management is a single configured rule set
- No monitoring required after signal entry
The Automation Rules
Regardless of platform, the logical rules being implemented are the same. Any automation system for these spreads needs to execute this sequence:
On signal alert → open spread
Receive Phoenix or Lynx entry alert, identify correct spread (put or call based on direction), execute at mid or market. Record the credit collected.
On fill → place stop loss at 3.5× credit
Immediately after fill confirmation, place a stop loss on the full position at 3.5× the credit collected.
When spread reaches threshold (62% of credit) → convert C1
Cancel stop loss on C1. Activate trailing stop on C1 at 26% of current profit. (On Path C this step is replaced by the GTC limit firing at the threshold price.)
When futures stop loss fires → close all lots
Receive Phoenix or Lynx stop loss alert. Close all open lots immediately at market regardless of current spread value.
When C1 trail fires → activate C2 breakeven stop (if before 2:00 PM ET)
C1 exits via trail. Immediately place GTC limit on C2 at original credit minus $0.10 (breakeven lock). Cancel any remaining stop loss covering C2.
C2 rides to expiration or breakeven stop → done
No further action required. The breakeven stop closes C2 if the spread reverses. Otherwise it expires naturally.
Trade Automation Toolbox (TAT)
TAT is a professional-grade trade automation platform developed by Kyle at Trade Automation Toolbox, designed specifically for NinjaTrader-based strategies. It bridges Phoenix and Lynx futures signals to options execution via a rules engine that can monitor spread prices and fire conditional orders in real time.
- Deep NinjaTrader integration — reads Phoenix and Lynx signals directly
- Real-time spread price monitoring for threshold conversion
- Handles complex conditional order sequences
- Supports full 2-lot C1/C2 management rules
- Futures sync rule can be implemented natively
- Subscribers already running Phoenix and Lynx in NinjaTrader
- Traders comfortable with a technical setup process
- 2-lot spreads where automation ROI is highest
- Full end-to-end automation from futures signal to options close
Options Alpha
Options Alpha is a retail-friendly options automation platform with a visual rule builder. Subscribers who are not running NinjaTrader can use Options Alpha to automate the Trailing Profit Lock exit sequence through a browser-based interface without coding.
- Visual rule builder — no coding required
- Monitors spread prices in real time
- Conditional actions (if spread ≤ threshold, then activate trail)
- Broker integration via API (TD/Schwab, Tradier, others)
- Suitable for traders who don’t run NinjaTrader
- Subscribers trading options only (no futures account needed)
- Traders who prefer a visual setup process
- Anyone wanting Path A without a technical installation process
- Smaller accounts where a simpler platform is appropriate
Current Status
| Item | Status |
|---|---|
| Trailing Profit Lock rule specification (62% threshold, 26% trail) | Complete — documented in Lesson 4 |
| C2 breakeven activation rules | Complete — documented in Lesson 7 |
| Futures sync rule (close on futures stop) | Complete — confirmed in simulation |
| TAT integration — rule implementation | In progress with Kyle at TAT |
| Options Alpha rule templates | In progress — Bill Mietelski live testing |
| Setup guides and video walkthroughs | Pending platform integration completion |
What to Do In the Meantime
While automation integration is being finalized, the strategy is fully tradeable using the manual paths documented in Lessons 4 and 6:
- Path C (Fixed PT) — GTC limit at 62% of credit ($1.24 on $2.00), stop loss at 3.5×. Fully set-and-forget. No monitoring required. Suitable for any lot size.
- Path B (Manual Trail) — Monitor for threshold, manually convert to trailing stop. Practical for 1-lot spreads with active monitoring.
Both paths produce strong results. Path C in particular — the fixed GTC limit at the 62% threshold — significantly outperforms the old 30-minute rule that most subscribers are currently using. Transitioning to Path C now while automation is finalized is a meaningful immediate improvement.
Research Methodology & Ongoing Testing
The numbers in this course are not estimates or back-of-envelope calculations. They are the product of a purpose-built research infrastructure that ran over 14 million individual spread simulations against real historical options prices. This lesson documents that infrastructure, the key findings it produced, and the research currently in progress.
Why This Matters
Most options trading courses publish performance estimates derived from directional analysis of the underlying futures or equity — not from actual options prices. That approach produces optimistic numbers because it ignores bid/ask spread friction, intraday price behavior of the spread itself, and the real-world relationship between the underlying move and the options value at any given minute.
The Phoenix options research uses a fundamentally different approach: every performance figure in this course is derived from actual historical SPX options prices, minute by minute, for every trade signal, from May 2022 through the present.
Previous Methodology — What Changed and Why
The original Phoenix options course published performance estimates derived from futures MAE/MFE analysis — Maximum Adverse Excursion and Maximum Favorable Excursion data from the NQ futures trades themselves. This was a reasonable approximation given the tools available at the time.
The logic was sound: if a futures trade moved favorably by X points before reversing, and the SPX options spread needed Y points of favorable movement to close profitably, then we could estimate the options win rate by measuring how often X exceeded Y across the historical trade set.
The limitation: this approach estimates options behavior from futures price data. It cannot account for:
- Intraday bid/ask spread on the options themselves
- Theta decay varying by time of day, IV environment, and strike distance
- The exact spread value at any specific minute during the trade window
- How the spread behaves when the futures stop loss fires mid-session
- The real P&L of different exit strategies applied minute by minute
The current research replaces all estimated values with measured values. The 70.4% win rate is not an estimate — it is the measured result of simulating 1,687 real competition mode signals against real SPXW 0DTE bid/ask prices, one minute at a time, from May 2022 through May 2026.
Lynx is a momentum strategy with a ~52% futures win rate and a 2:1 reward-to-risk ratio. When Lynx is right, the market moves decisively — which drives strong spread decay and benefits options traders. But blending Lynx with Phoenix lowers the combined futures win rate to ~62%, which pulls the options win rate down to 70.4%. The lower win rate is the price of 44% more signals. The net result is nearly double the absolute return — more signals and stronger C2 scale-out outcomes more than compensate for the lower per-trade win rate.
The Research Infrastructure
Two Analytical Databases
The research runs on two local DuckDB databases, kept separate to isolate market data from strategy research results.
| Database | Contents | Size |
|---|---|---|
| marketdata.duckdb | SPXW 0DTE options: bid, ask, delta, IV — every minute, every strike, every expiration from May 2022 to present. NQ and ES bar data (M1, M5, M30) from Dec 2019 to present. VIX daily history. | 172,771,170 options rows — 724,400 bar rows |
| research.duckdb | All strategy trade histories, signal strike selections, simulation results, optimizer runs, and yearly breakdowns. | 10,813 trades — 31,782 signal strikes — 7,286 spread results — 419 optimizer runs |
The Four Strategies
Four trading strategies are loaded in the research database, covering two instruments:
| Strategy | Instrument | Timeframe | Role |
|---|---|---|---|
| Phoenix NQ | NQ futures | M5 | Primary NQ strategy — higher win rate, mean-reversion |
| Lynx NQ | NQ futures | M5 | Complementary NQ strategy — fires in Phoenix gaps |
| Competition (Phoenix + Lynx) | NQ futures | M5 | Recommended for options traders — combined signal stream, best P/DD |
| Aspen | ES futures | M30 | Robustness validation — ES as secondary instrument |
Bar Data Coverage
| Dataset | Date Range | Notes |
|---|---|---|
| NQ M5 bars | Dec 16, 2019 – May 15, 2026 | Primary strategy timeframe for Phoenix and Lynx |
| NQ M1 bars | Dec 16, 2019 – May 15, 2026 | Used for intra-trade analysis and MAE/MFE research |
| ES M30 bars | Jan 2, 2009 – May 15, 2026 | Aspen strategy timeframe |
| SPXW 0DTE options | May 11, 2022 – May 15, 2026 | Daily SPX expirations available from May 2022. 172,771,170 rows. |
Strike Selection
For each signal, the research infrastructure automatically selects the appropriate SPX spread using a Black-Scholes delta-targeting algorithm written in Python. The algorithm:
- Determines the correct option type (puts for LONG signals, calls for SHORT signals)
- Uses put-call parity to derive the SPX spot price at signal entry time from the options chain itself
- Selects the short strike closest to the target delta (10–25Δ, step 1.0)
- Selects the long strike at the target width ($15–$30) further OTM
- Records the net credit at the bid/ask midpoint at entry time
- Applies a minimum credit filter ($1.95) — signals that can’t meet the threshold are excluded
The result is a dataset of 31,782 signal-to-strike mappings across all strategies and configurations, each paired with a specific SPX spread, a real entry credit, and a complete minute-by-minute price history for that spread from entry through end of session. The average credit across Competition mode signals in the final configuration is $205.19 per contract.
The Optimizer
The grid search optimizer is a Python application that tests every combination of exit parameters against the signal dataset. For each combination it simulates:
- Contract 1 (C1) exit: every minute of every trade, checking whether the profit threshold, trailing stop, or stop loss has fired
- Contract 2 (C2) exit: from C1’s exit time to end of session, checking the breakeven stop
- Futures sync rules: truncating the options series at the futures exit time when the futures strategy stopped out
- Overlap logic: blocking new signals while C1 is still open (no-overlap setting)
- PM cutoff: excluding signals after 2:00 PM ET from C2 scale-out activation
- Commission model: $1.09/contract all-in, applied correctly for each exit type
Each parameter combination produces a complete P&L series, which is then passed through a risk metrics calculator that produces Sharpe ratio, K-Ratio, Ulcer Index, MAR ratio, max drawdown, and profit-to-drawdown ratio. Results are ranked and exported to CSV for analysis.
Key Research Findings
1. Competition Mode (Phoenix + Lynx) Dramatically Outperforms Phoenix Alone
The most significant structural finding was that adding Lynx signals to the Phoenix alert stream nearly doubles the risk-adjusted performance — not just because of more signals, but because of the asymmetric benefit to the two-contract scale-out.
| Signal Source | Qualifying Spreads | Net 4yr | P/DD |
|---|---|---|---|
| Phoenix NQ only | 1,386 | ~$29,000 | 6.1× |
| Competition (Phoenix + Lynx) | 1,687 | $52,619 | 12.7× |
2. The Trailing Profit Lock Outperforms All Fixed Exits
The most significant exit method finding was discovered through a suggestion from subscriber Bill Mietelski, who was independently testing a trailing stop approach in Options Alpha on live trades. His question — what if the trailing stop activates only after the profit threshold is hit, rather than from entry? — led directly to the development and testing of the Trailing Profit Lock.
| Exit Method | Net 4yr (2-lot) | Max DD | P/DD | Sharpe |
|---|---|---|---|---|
| Fixed PT + 30-min time stop | $23,693 | $5,876 | 4.0× | 1.22 |
| Fixed PT + ride to end of day | $47,035 | $4,272 | 11.0× | 1.94 |
| Trailing Profit Lock (62%, 26% trail) | $52,619 | $4,132 | 12.7× | 2.15 |
3. The Profit Threshold Peaks at 62%
The profit threshold was tested from 56% through 65%. The results form a clean peak at 62% and fall off on both sides.
| Threshold | Spread Value at Trigger ($2.00 credit) | Best P/DD (2-lot) |
|---|---|---|
| 58% | $1.16 | 11.3× |
| 60% | $1.20 | 11.9× |
| 62% | $1.24 | 12.7× |
| 63% | $1.26 | 12.3× |
| 64% | $1.28 | 11.0× |
| 65% | $1.30 | 9.9× |
4. The Trail Stop Percentage Is Remarkably Flat
The trail stop percentage was tested from 22% through 30%. The entire range produced less than 0.2x difference in P/DD. The peak sits at 26% but any value from 22–30% is defensible. This flatness is good news — the exact trail stop percentage is not a critical precision decision.
5. The Minimum Credit Floor Peaks at $1.95
The minimum credit floor was tested from $1.90 through $2.25. Results peaked at $1.95 and degraded in both directions. Raising the floor above $2.00 significantly hurt performance because the larger stop loss dollar amount (3.5× higher credit) more than offset the premium improvement. The recommended range is $1.95–$2.00.
| Min Credit | Signals | Avg Credit | P/DD |
|---|---|---|---|
| $1.90 | 2,045 | $199 | 11.5× |
| $1.95 | 1,687 (filtered) | $205 | 12.7× |
| $2.00 | 1,669 (filtered) | $210 | 11.7× |
| $2.10 | 1,931 | $220 | 9.2× |
| $2.25 | 1,823 | $236 | ~8.0× |
6. No-Overlap Outperforms Allow-Overlap
Allowing new signals to enter while C2 is still riding was tested explicitly. Overlapping signals added 167 more trades but hurt risk-adjusted performance significantly — more concurrent positions compounded losses during adverse periods without proportionally increasing winners. No-overlap is the correct setting.
Without this rule you could have C2 open from a previous trade riding toward expiration while a new C1 opens on a fresh signal — potentially in opposite directions, with compounding risk. If both go wrong simultaneously the loss is double.
In testing, allowing overlaps added 167 more trades but dropped P/DD from 12.7× to 8.6×. The additional signals weren’t worth the compounded loss risk. Roughly 324 signals per 1,687 simulated were skipped due to overlap — about 1 in 5.
7. Final Configuration — Summary
| Parameter | Value | Result |
|---|---|---|
| Signal source | Competition mode (Phoenix + Lynx NQ) | 1,993 qualifying spreads found |
| Delta range | 10–25Δ, step 1.0 | Avg delta 18.2 |
| Width range | $15–$30 | Optimal — wider tested, no improvement |
| Min credit | $1.95–$2.00 | Avg credit $205.19 |
| PT threshold | 62% of credit | Peak of tested range |
| Trail stop | 26% of peak profit | Flat range 22–30% all acceptable |
| Stop loss | 3.5× credit | Optimal multiplier |
| Overlap | No overlap | Better than allow-overlap |
| PM cutoff | 2:00 PM ET | No new entries after cutoff |
| Signals simulated | 1,687 (after PM cutoff + overlap filter) | 324 skipped for overlap |
| Net 4yr (2-lot) | $52,619 | P/DD 12.7× — Sharpe 2.15 — CAGR 58.7% |
What Has Not Been Tested
The current research is comprehensive but not exhaustive. The following areas are queued for future testing.
The current research uses a 2:00 PM ET cutoff for new entries. Untested: whether a 1:00 PM or 1:30 PM cutoff — restricting to morning signals only — improves the C2 expired-worthless rate and overall performance by ensuring more session time remains for theta decay after C1 exits.
Low-effort test: add PM_CUTOFF_HOURS = [13, 14] to the optimizer grid.
The current model exits on price-based rules only. Untested: using the options gamma of the spread as a real-time risk signal. As a 0DTE spread approaches expiration and gets closer to the short strike, gamma accelerates — monitoring gamma could provide early warning of accelerating risk.
The research database already contains gamma data. No additional data collection required.
Competition mode on ES significantly underperformed Phoenix ES alone — because Lynx was built and tuned for NQ, not ES. Untested: whether a separate Lynx variant tuned specifically on ES data would improve Competition mode performance on ES.
This is a futures research project, not an options research project. Lower priority given ES is the secondary instrument.
The current course exclusively uses vertical credit spreads. Untested alternatives include long calls/puts (directional debit trades), diagonal spreads, and buying back the long leg after the short leg decays to near zero.
Each structure has different risk/reward characteristics and would require separate simulation infrastructure.
Acknowledgments
The Trailing Profit Lock — the exit method that is now the foundation of the entire options trading approach — was inspired by subscriber Bill Mietelski, who was independently testing a trailing stop implementation in Options Alpha on live trades. His question about activating the trail only after a profit threshold is reached, rather than from entry, led directly to the research that produced this course update.
Bill’s work also confirmed the practical viability of automation for this strategy. The ability to implement a dynamic trailing stop through platforms like Options Alpha and Trade Automation Toolbox (TAT) was a critical consideration in choosing the Trailing Profit Lock over simpler alternatives.
The research infrastructure — the two DuckDB databases, the Python optimizer, the simulation engine, and the strike selection algorithm — was built entirely in-house by Aeromir Corporation specifically for this project.
Research Specifications Summary
| Parameter | Value |
|---|---|
| Options data source | Professional options data API — actual bid/ask prices, not derived or interpolated |
| Options coverage | May 11, 2022 – May 15, 2026 (SPX 0DTE daily expirations) |
| Options rows | 172,771,170 price snapshots |
| Bar data coverage | Dec 16, 2019 – May 15, 2026 (NQ M1, M5 and ES M30) |
| Bar rows | 724,400 |
| Strategies loaded | 4 (Phoenix NQ, Lynx NQ, Competition, Aspen ES) |
| Total trades in database | 10,813 across all strategies |
| Signal strikes mapped | 31,782 across all configurations |
| Spread results stored | 7,286 |
| Parameter combinations tested | 9,600 across 96 optimizer runs |
| Total spread simulations run | 14,002,946 |
| Competition mode signals simulated | 1,687 (after PM cutoff and overlap filter) |
| Commission model | $1.09/contract all-in (Schwab/ThinkorSwim rate) |
| Exit simulation granularity | 1-minute bars — every bar checked for every exit condition |
| Recommended configuration | PT=62%, Trail=26%, SL=3.5×, C2 breakeven=$0.10, min credit=$1.95 |
| Final result (2-lot spread) | Net $52,619 / DD $4,132 / P/DD 12.7× / Sharpe 2.15 / CAGR 58.7% |
Get Full Access to This Course
Visit the course page to learn more and purchase.
Learn More Current Subscriber? Login Back to Courses